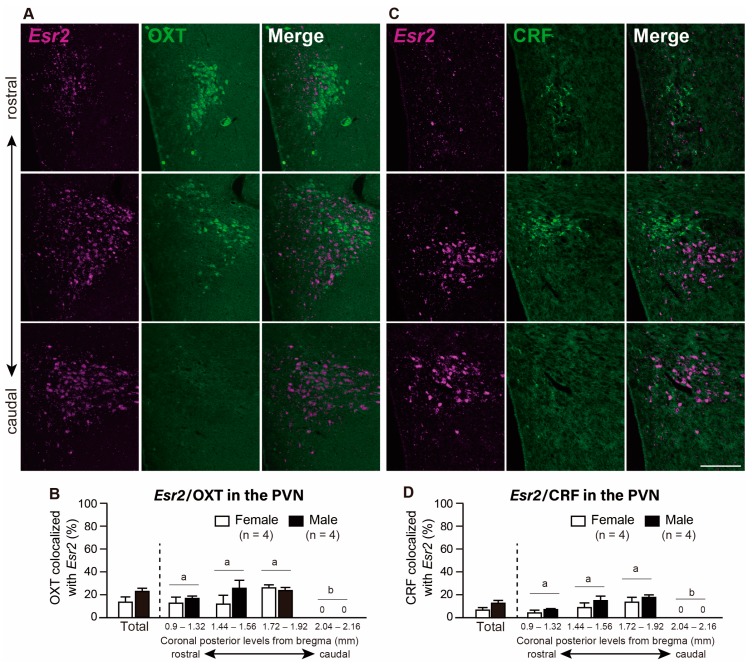
Figure 4.
Co-expression of Esr2/oxytocin (OXT) and Esr2/corticotropin-releasing factor (CRF) in the paraventricular nucleus of the hypothalamus (PVN). Representative photomicrographs show dual labeling of Esr2 mRNA (magenta) and OXT (green) in the PVN of female rats (A), and dual labeling of Esr2 mRNA (magenta) and CRF (green) in the PVN of female rats (C). Arrowheads indicate double-labeled cells. Scale bar indicate 200 µm in A and C. The bar graph shows the percentage of co-expression of Esr2 mRNA/OXT-ir cells (B) and Esr2 mRNA/CRF-ir cells (D) in the whole PVN and the PVN at different rostro-caudal levels (from bregma −0.9 to −2.16 mm). Values represent the mean ± SEM. Differences in values that are significantly (p < 0.05) different from each other are indicated by letters * p < 0.05.

