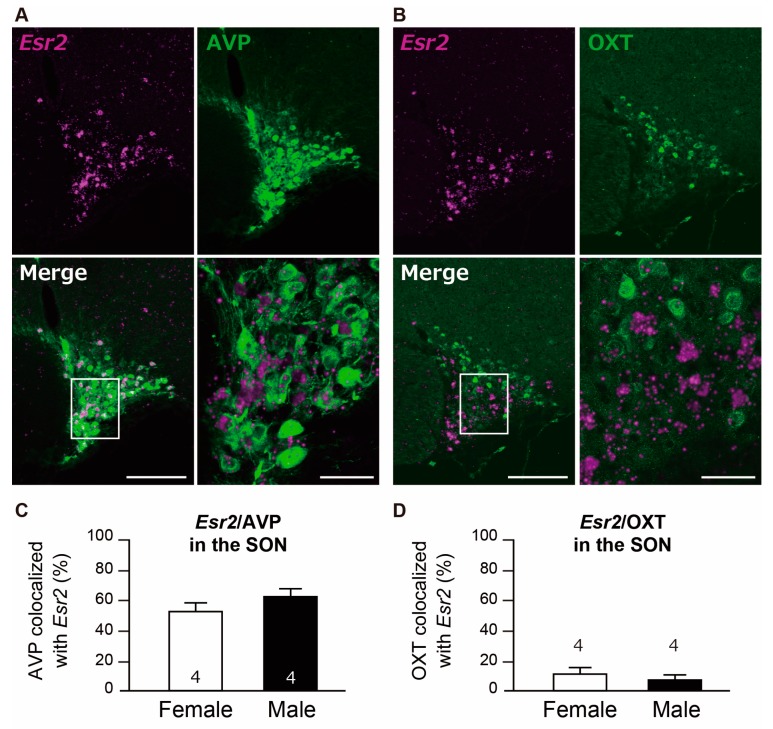
Figure 5.
Co-expression of Esr2/arginine vasopressin (AVP) and Esr2/oxytocin (OXT) in the supraoptic nucleus (SON). Representative photomicrographs show dual labeling of Esr2 mRNA (magenta) and AVP (green) in the SON of female rats (A), and dual labeling of Esr2 mRNA (magenta) and OXT (green) in the SON of female rats (B). High magnification images (the bottom right images) correspond to the boxed areas in the overviews in A and B. Scale bar measures 50 µm for high magnifications and 200 µm for low magnification images in A and B. The bar graph shows the co-expression percentage of Esr2 mRNA/AVP-ir cells in the SON (C) and Esr2 mRNA/OXT-ir cells in the SON (D). Values represent the mean ± SEM. The number in each column indicates the number of animals used.

