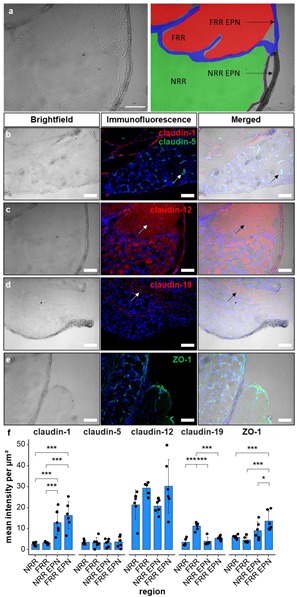
Figure 1.

Claudin-1 immunoreactivity (IR) and ZO-1 IR are preferentially found in epi-/perineurium in rats’ dorsal root ganglia (DRGs), while claudin-19 IR is most abundant in the fiber-rich region. Classification into neuron rich region (NRR, green), NRR epi-/perineurium (EPN, black), fiber rich region (FRR, red), and FRR-EPN (blue) is shown in (a). Control DRG sections (CL) from Wistar rats were immunostained. IRs of claudin-1, claudin-5, and ZO-1 were quantified and compared between NRR and FRR, together with their putative EPN. Representative stainings for claudin-1 (red), claudin-5 (green) (b), claudin-12 (c), claudin-19 (d), and ZO-1 (e) are shown. Arrows point to structures identified as vessels (b), Schwann cells (c), and paranodes of Schwann cells (d). Quantification of the signal intensity in the specified areas (f). (Scale bars = 100 µm; n = 5 or 6; claudin-1: NRR versus NRR-EPN, NRR versus FRR-EPN, FRR versus NRR-EPN, and FRR versus FRR-EPN: p < 0.0001; ZO-1: FRR-EPN versus NRR: p = 0.0003; FRR-EPN versus NRR-EPN: p = 0.0138; FRR-EPN versus NRR: p = 0.00018. No normal distribution: ZO-1 FRR. No variance homogeneity: claudin-1. Two-way ANOVA, Tukey HSD. * p < 0.05, *** p < 0.001).
