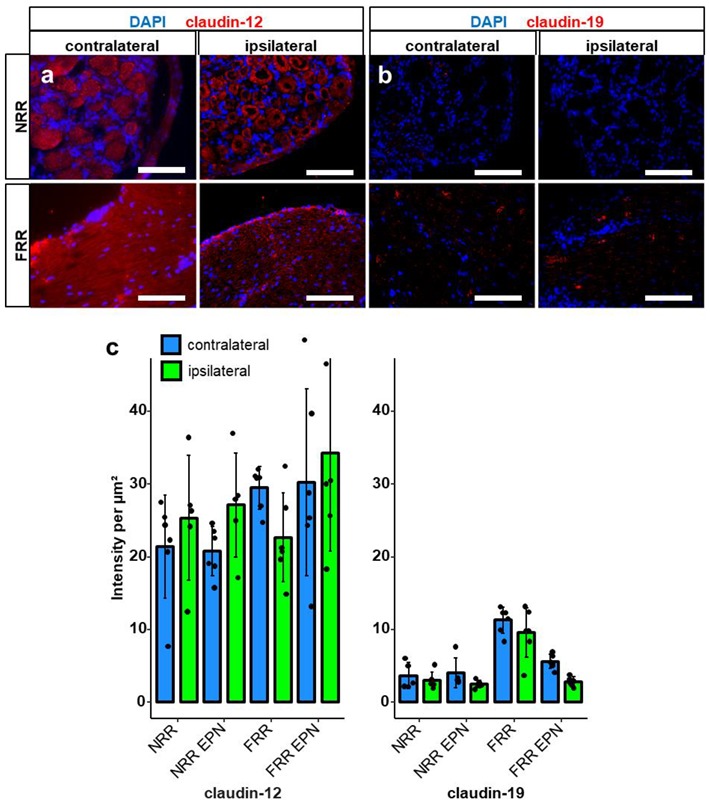
Figure 5.

Claudin-19 and claudin-12-IR are unaltered after CCI. After CCI, DRG sections of Wistar rats were immunostained. IRs of claudin-12 and claudin-19 were quantified as light intensity per µm2. and compared between IL and CL DRGs after CCI in the NRR and FRR, and their putative EPNs. Representative sections of claudin-12 (red) (a) and claudin-19 (red) (b) are shown. Quantification of the signal intensity in the specified areas: significant differences between regions are not indicated, as they were already analyzed in Figure 1 (c). (Scale bars = 100 µm. n = 5 or 6; claudin-19: FRR versus NRR, FRR versus NRR-EPN, and FRR versus FRR-EPN: p < 0.0001. No normal distribution: claudin-19 CL NRR-EPN. Two-way ANOVA, Tukey HSD).
