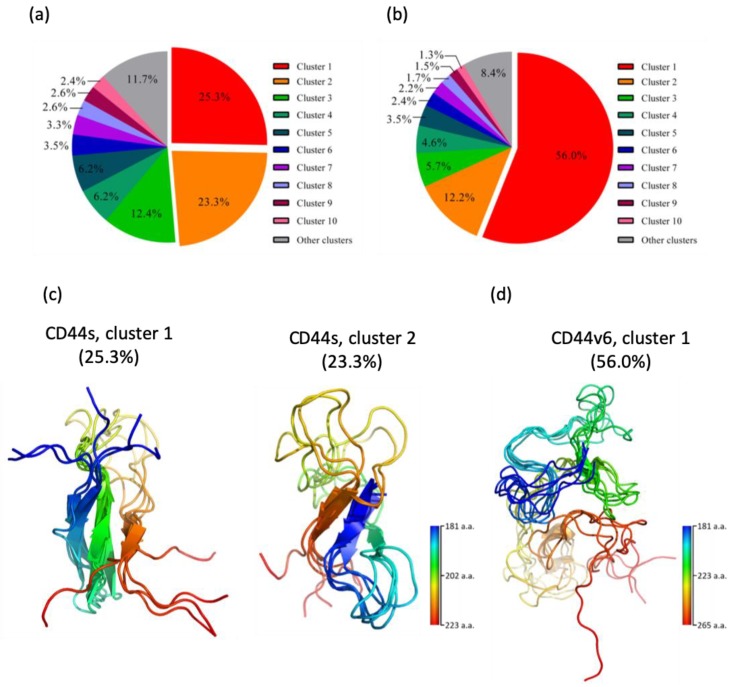
Figure 3.
Clustering analysis of the CD44s and CD44v6 stem regions. (a) Population distribution of each cluster of the CD44s stem region. (b) Population distribution of each cluster of the CD44v6 stem region. (c) Structures of the most populated clusters of the CD44s stem region, cluster 1 and cluster 2. (d) Structures of the most populated cluster of the CD44v6 stem region, cluster 1. Ensemble structures are rainbow-colored from blue at the N-terminus to red at the C-terminus.

