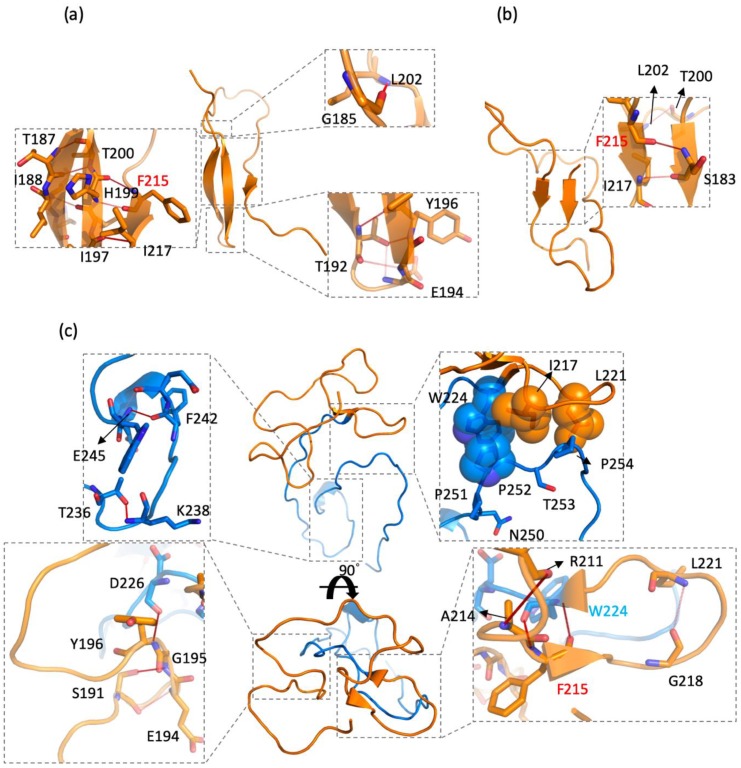
Figure 6.
Detailed hydrogen bonds and intramolecular interaction networks: (a) the CD44s stem region, cluster 1 (also see Table S1); (b) the CD44s stem region, cluster 2 (also see Table S2); (c) the CD44v6 stem region, cluster 1 (also see Table S3). The standard stem region is colored orange, and the v6 region is colored blue. The key residues involved in interactions are shown in sticks. The key residues involved in the hydrophobic contacts with Pro252 are shown in spheres. Hydrogen bonds are depicted with red dash lines.

