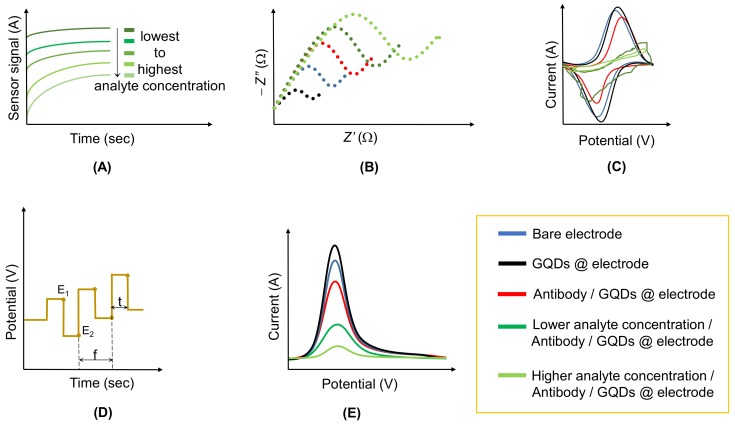
Figure 5.
(A) Amperometric curves for the different concentrations of target analyte. (B) Nyquist plot: Change in the impedance upon electrode functionalization and analyte addition. (C) Cyclic voltammogram of a GQD-coated electrode, where its electrochemical response varies upon the specific binding of antibody to analyte. (D) Potential time profile of square wave voltammetry (SWV), where E1: Initial potential; E2: Potential after pulse; f: Pulse frequency; t: Pulse duration. (E) Representation of the analyte detection by means of GQD-coated electrodes, where the variation in current is proportional to the antibody occupancy.

