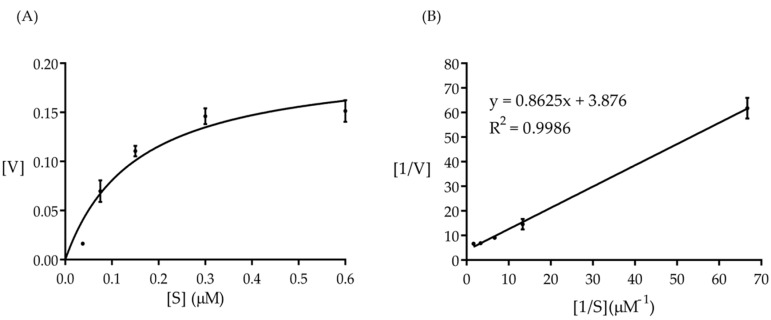
Figure 2.
Kinetic analysis of Amuc_1434* hydrolyzed hemoglobin (substrate). (A) Michaelis–Menten kinetics plot. The initial reaction rates versus different hemoglobin concentrations. [V] represented reaction rate, [S] represented haemoglobin concentrations. Graphpad Prism software, version 7, was used to fit the data into the Michaelis–Menten equation with a non-linear regression method. (B) Double reciprocal (Lineweaver–Burk) plot of the initial rate of hemoglobin hydrolysis by Amuc_1434* versus hemoglobin concentration.

