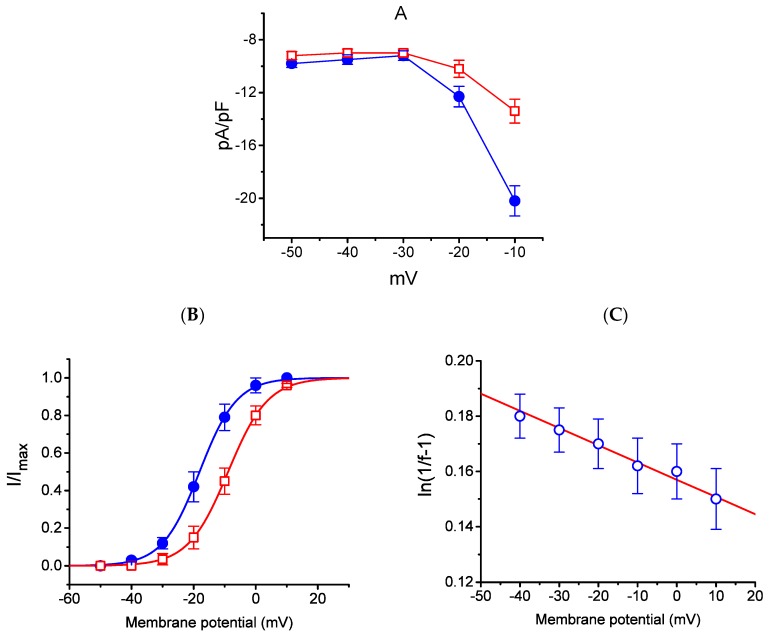
Figure 5.
Effect of HBA on the average current density–voltage relations of IK(M) density (A), the steady-state activation curve of IK(M) (B), and the voltage-dependence of HBA-induced blocking of the current (C) in GH3 cells. Cells were bathed in high-K+, Ca2+-free solution and the pipette was filled with K+-containing solution. Once the whole-cell model was established, the examined cell was held at −50 mV and various voltages ranging between −50 and +10 mV were applied. (A) The relationship between IK(M) density and membrane potential obtained in the presence (● blue) and presence (□ red) of 10 µM HBA (mean ± SEM; n = 9 for each point). (B) The activation curve of IK(M) in the absence (● blue) and presence (□ red) of 10 µM HBA (mean ± SEM; n = 11 for each point). The smooth curves obtained with or without the addition of HBA were least-squares fitted by a Boltzmann function as detailed in the Materials and Methods Section. (C) Voltage dependence for HBA-induced blocking of IK(M) in GH3 cells (mean ± SEM; n = 10–11 for each point). The line overlaid onto the data was fitted using the equation as detailed in the Materials and Methods Section. The Kd value (the equilibrium constant at 0 mV) and (the relative electrical distance of the blocking site in the transmembrane electrical field) were estimated to be 11.7 µM and 0.016, respectively.

