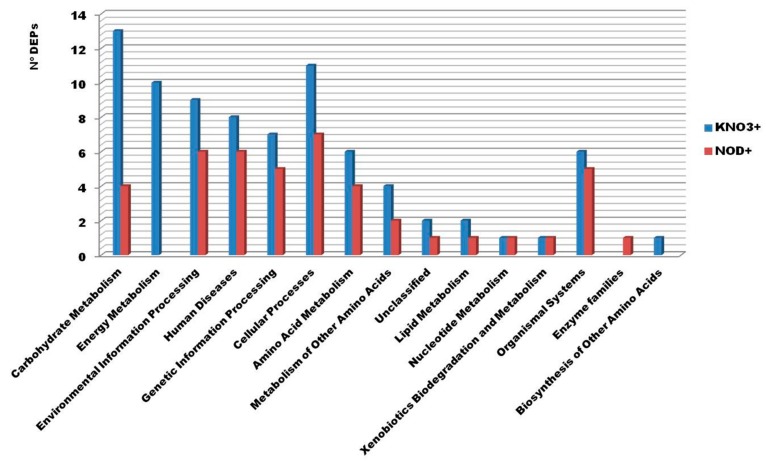
Figure 3.
Kyoto Encyclopedia of Genes and Genomes (KEGG) enrichment analysis of the identified differentially expressed proteins (DEPs) from C. glauca branchlets at different salt concentrations for KNO3+ and NOD+ plants. The X-axis indicates de KEGG pathway and the Y-axis the number of DEPs assigned to a specific pathway. The blue column represents the 43 DEPs from KNO3+ and the red column the 25 DEPs from NOD+.

