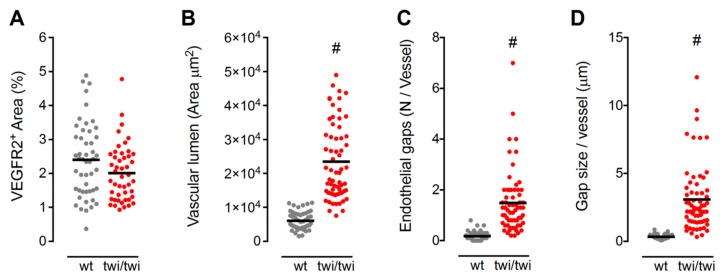
Figure 5.
Quantification of BM vascular abnormalities in twitcher mice. (A) Quantification of the BM area occupied by VEGFR2+ diaphyseal SECs. Each dot represents the percentage VEGFR2+ area per microscopic field. (B–D) Morphometric parameters of VEGFR2+ diaphyseal SECs, including area of the vessel lumen (B), number of endothelial gaps per vessel (C), and size of endothelial gaps (D). For each parameter, dots represent the mean value measured in different microscopic fields. Horizontal black bars show the mean value. #, p < 0.001.

