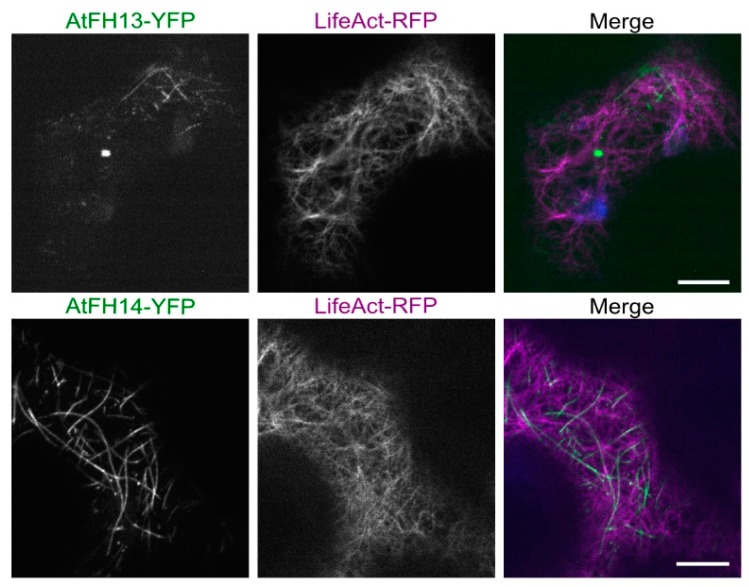
Figure 3.
Single optical sections of epidermal cells co-expressing AtFH13-YFP or AtFH14-YFP with the actin marker LifeAct-RFP. Images from single channels are shown in grayscale, merged images display an overlay of three channels represented by green (YFP), magenta (RFP), and blue (chloroplast autofluorescence). Scale bars are 10 µm. Construct abbreviations are defined in the text and in Figure 1.

