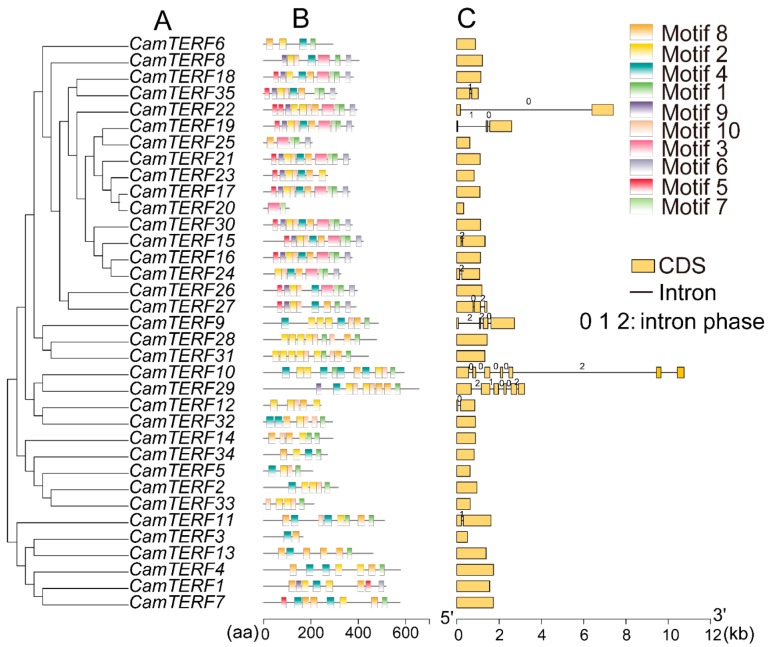
Figure 3.
Phylogenetic relationship, conserved motif, and gene structure analysis of CamTERFs. (A) Phylogenetic tree of 35 CamTERFs. Depicted is an unrooted neighbor-joining phylogenetic tree; (B) Distributions of conserved motifs in CamTERFs. Ten putative motifs are indicated with different colored boxes. For details of motifs refer to Table 2; (C) Exon/intron organization in CamTERFs. Yellow boxes represent exons and black lines represent introns. The numbers 0, 1, and 2 represent the intron splicing phase. Exon length can be inferred by the scale at the bottom.

