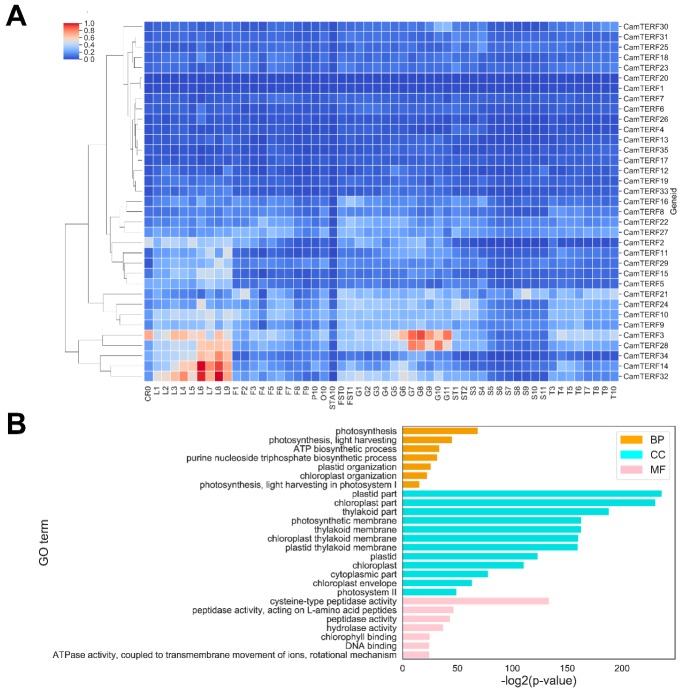
Figure 6.
(A) Expression profiles of CamTERFs in different tissues and organs. CR0: root control; L1–L9: Leaf from 0 DAG to 50 DAG; F1–F9: Flower from 0 DAG to 50 DAG; P10: Petal; O10: Ovary; STA10: Stamen; FST0 and FST1: Whole fruit from 3 DAP and 7 DAP; G1–G11: Pericarp from 10 DAP to 60 DAP; ST1 and ST2: Placenta and Seed from 10 DAP to 15 DAP; S3–S11: Seed from 20 DAP to 60 DAP; T3–T10: Placenta from 20 DAP to 60 DAP. DAG: Days after germination; DAP: Days after pollination; (B) Analysis of gene ontology (GO) enrichment for co-expressing CamTERFs. GO term categorization includes biological process (BP), cellular component (CC), and molecular function (MF).

