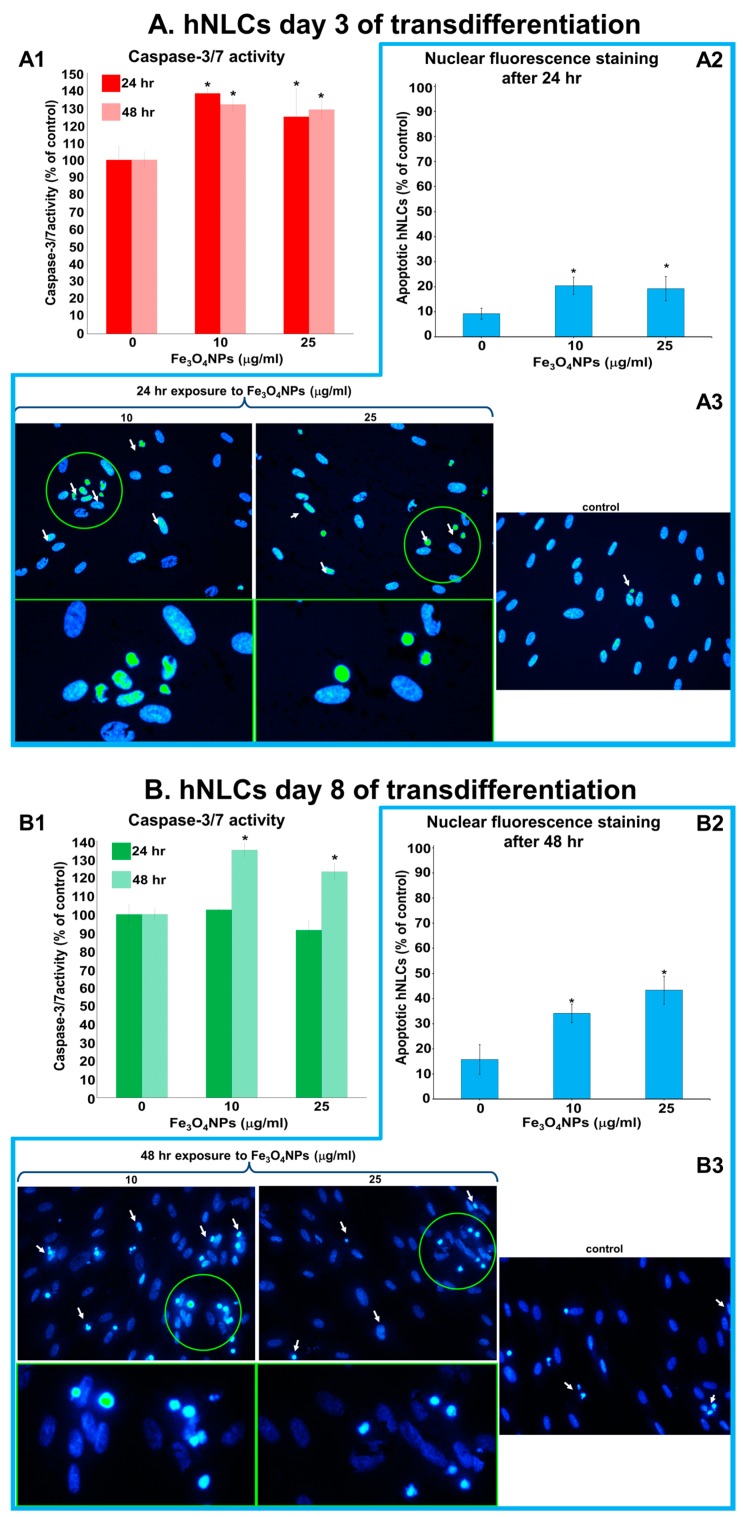
Figure 8.
Caspase-3/7 activity and apoptotic cells evaluation after exposure to Fe3O4NPs (10 and 25 μg/mL). (A) Composite images that display the caspase-3/7 activity evaluated after 24 and 48 h exposure to Fe3O4NPs (A1) and apoptotic cells detected by Hoechst 33258 staining after 24 h exposure to Fe3O4NPs in hNLCs at day 3 of transdifferentiation (A2,A3). (B) Composite images that show the caspase-3/7 activity evaluated after 24 and 48 h exposure to Fe3O4NPs (B1) and apoptotic cells detected by Hoechst 33258 staining after 48 h to Fe3O4NPs in hNLCs at day 8 of transdifferentiation (B2,B3). The caspase-3/7 activity of the control cells was set to 100% and the data are expressed as mean ± S.D. * p < 0.05. Statistical analysis by two-way ANOVA followed by Dunnett’s test. Apoptotic cells were expressed as % of total cell counted. Data represent the mean ± S.D. * p < 0.05. Statistical analysis by two-way ANOVA followed by Dunnett’s test. Representative images in fluorescence microscope are taken using magnification 40×, the areas indicated by the circle show the magnification 2.5-fold. Arrows indicate nuclear morphological changes such as chromatin condensation, fragmentation, and formation of apoptotic bodies.

