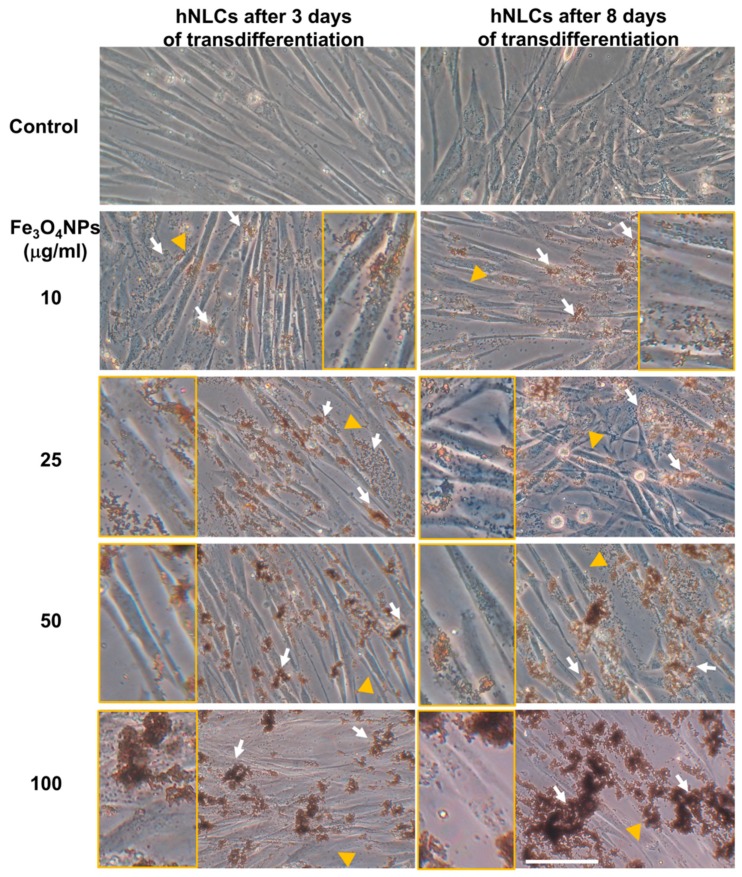
Figure 9.
Representative micrographs, by phase-contrast microscopy of early and full transdifferentiated hNLCs after 24 h exposure to increasing Fe3O4NPs concentrations (10–100 μg/mL). No morphological alterations were observed after Fe3O4NPs exposure up to 48 h, however, a cell density decrease was observed from 25 μg/mL Fe3O4NPs at both time points considered for both hNLCs. Brownish aggregates/agglomerates of Fe3O4NPs in culture medium are indicated by white arrows. Inserts show the magnifications (2×) of the areas indicated by the yellow arrowheads where Fe3O4NPs are visible inside of the hNLCs. Scale bar: 100 μm.

