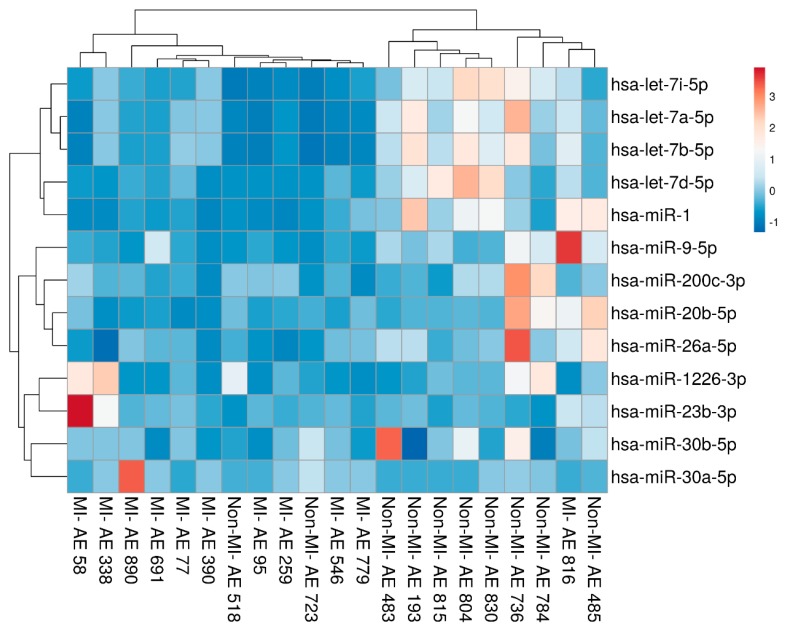
Figure 2.
Hierarchical clustering analysis of the differentially expressed miRNAs found in vascular smooth muscle cells (VSMCs) from aortic wall tissues. Each row represents the miRNA expression in MI versus non-MI samples; the columns show the expression profiles of the subjects in the MI and non-MI groups. Upregulated miRNAs are indicated in red, while downregulated miRNAs are indicated in blue.

