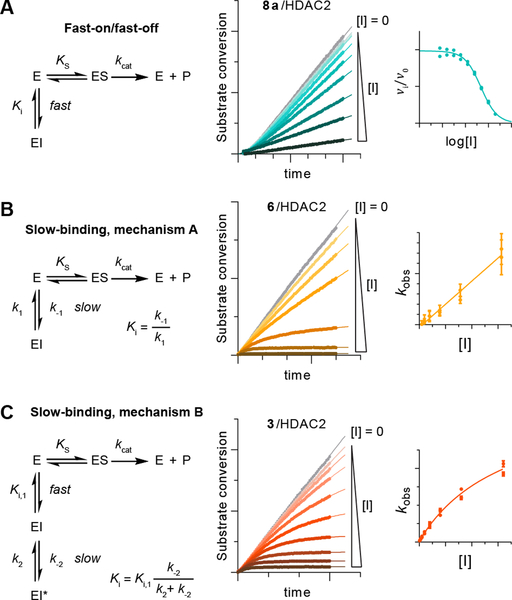
Figure 1. Representative examples of different kinetic mechanisms of HDAC inhibition.
Assay progression curves and secondary plots fitted to the relevant equation (see Supporting Information for more detail). (A) Fast-on/fast-off binding kinetics, exemplified by apicidin (6a), (B) mechanism A of slow-binding kinetics, exemplified by trapoxin A (4), and (C) mechanism B of slow-binding inhibition, exemplified by tacedinaline (3).

