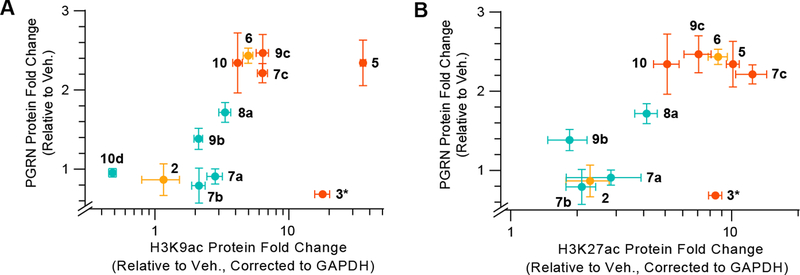
Figure 3. Relationship of PGRN expression to histone acetylation after HDAC inhibitor treatment.
Two-dimensional plots of changes in intracellular PGRN vs. changes in (A) H3K9 acetylation or (B) H3K27 acetylation upon 18 h compound treatment at 1 μM concentration. Colors relate to kinetic mechanisms against HDACs 1 and 2 (cyan: fast-on/fast-off, orange: mechanism A, red: mechanism B of slow-binding kinetics). Histone acetylation Western Blot data and images are included in Figure S7 and S8. *Tacedinaline (3) was dosed at 10 μM concentration.

