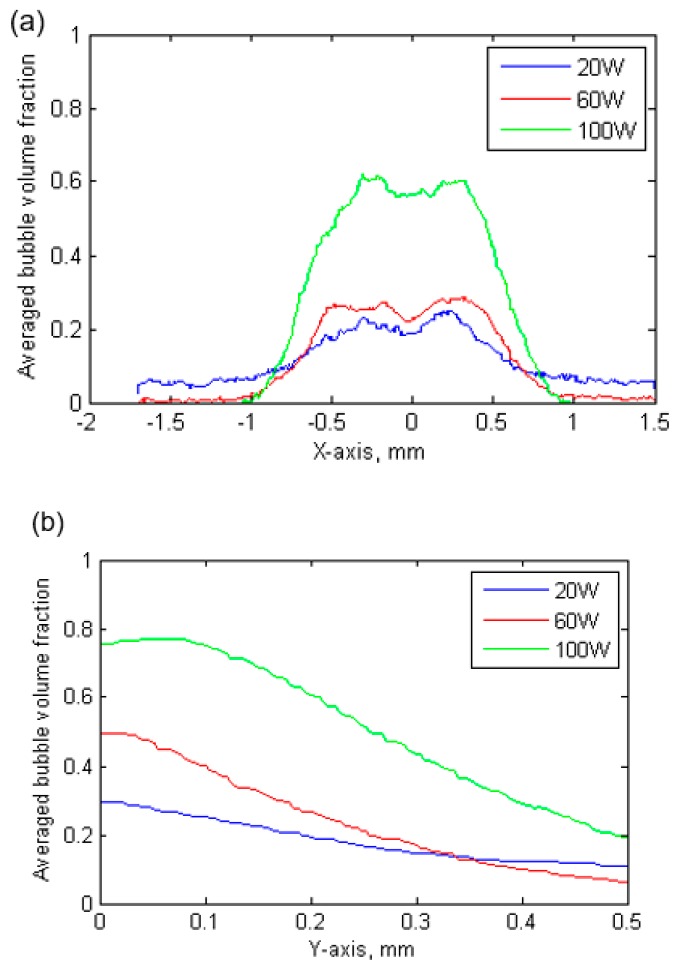
Figure 5.
The averaged bubble volume fraction in (a) horizontal direction from position −1.5 mm to 1.5 mm (X-axis), to show bubble volume fraction distribution in horizontal direction; in (b) vertical direction from sonotrode tip to 0.5 mm (Y-axis), to show bubble volume fraction distribution in vertical direction.

