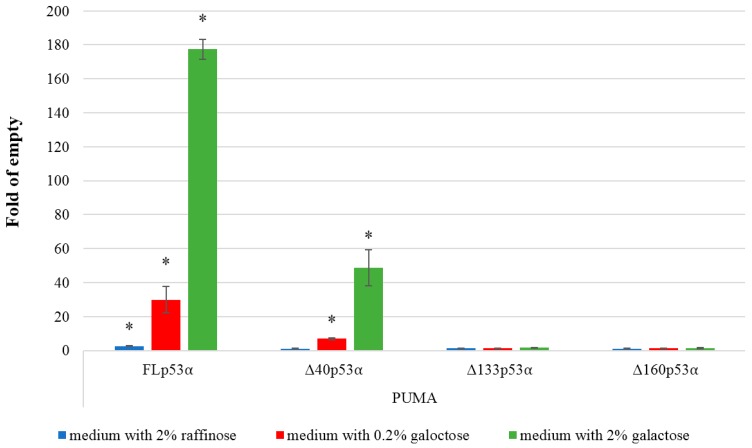
Figure 3.
p53-dependent transactivation potential in yeast. All p53α isoforms are expressed under an inducible GAL1 promoter. Histograms show the average fold induction over empty vector in three biological replicates (mean ± S.D.). The results with three levels of p53 induction (no induction, moderate, high) obtained after 24 h in inducing media are presented. Asterisks indicate a significant induction of p53 dependent transactivation (p < 0.05).

