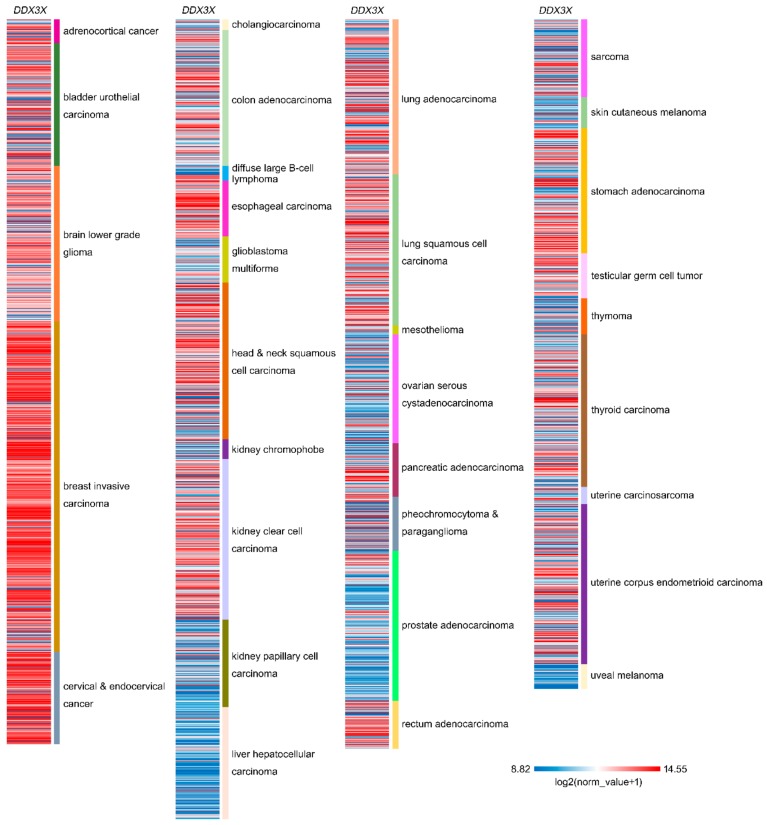
Figure 2.
Relative DDX3X expression in a pancancer panel. In a pancancer dataset from The Cancer Genome Atlas, DDX3X expression levels were presented separately for 32 cancer types. The red color in the heat map represents genes with high expression. The blue color in the heat map represents genes with low expression.

