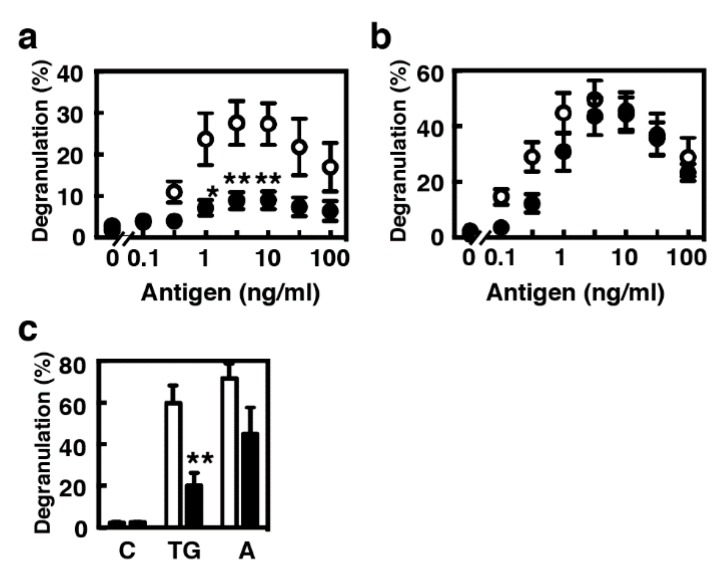
Figure 3.
Comparison of the profiles of antigen-induced degranulation between BMMCs and MCs/IL-9. (a,b) BMMCs (open circles) or MCs/IL-9 (closed circles) were sensitized with (a) 10 ng/mL or (b) 1 µg/mL anti-TNP IgE (clone IgE-3) for 3 h at 37 °C. The cells were twice washed and stimulated with the indicated concentrations of the antigen (TNP-conjugated BSA). The levels of degranulation were determined by measuring the enzymatic activity of β-hexosaminidase. Values are presented as the means ± SEM (n = 4). Multiple comparisons were performed using two-way ANOVA with the Sidak test. Values with * p < 0.05 and ** p < 0.01 are regarded as significant. (c) BMMCs (open columns) or MCs/IL-9 (closed columns) were stimulated without (C, vehicle) or with 300 nM thapsigargin (TG) or 1 µM A23187 (A). The levels of degranulation were determined by measuring the enzymatic activity of β-hexosaminidase. Values are presented as the means ± SEM (n = 4). Statistical analysis was performed using Student’s t-test. A value with ** p < 0.01 is regarded as significant.

