Figure 1.
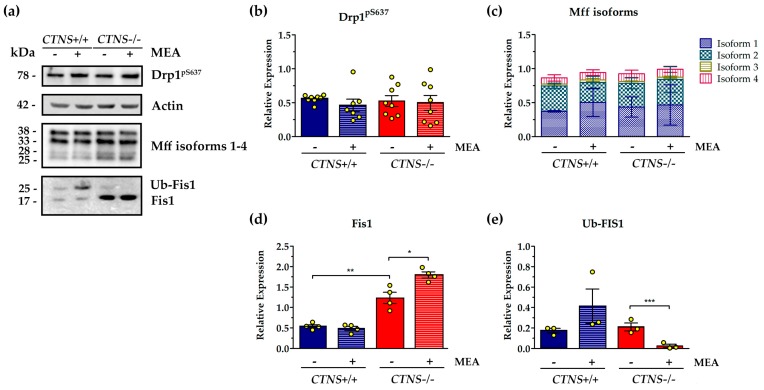
Analysis of proteins involved in fission process of mitochondrial dynamics in untreated and cysteamine (MEA)-treated CTNS−/−compared to CTNS+/+. Cell cultures were treated with 100 μM cysteamine (MEA) or DMSO (vehicle) for 24 h as specified in the figure. (a) Representative immunoblotting analysis in cellular lysate of conditionally immortalized proximal tubular epithelial cells (ciPTEC) from a healthy subject (CTNS+/+) and cystinotic patient (CTNS−/−). (b–e) The histograms (Drp1pS637, panel (b), n = 8; mitochondrial fission factor (Mff), panel (c), n = 3; mitochondrial fission 1 protein (Fis1), panel (d), n = 4; ubiquitinated Fis1 (Ub-Fis1), panel (e), n = 3) represent the means values ± SEM of the relative expression normalized on actin level. Densitometric analysis was performed by Versa-Doc imaging system BioRad, using Quantity One software. p-value less than 0.05 was considered as statistically significant, (Student’s t test, *** p < 0.001; ** p < 0.01; * p < 0.05). For further details see under “materials and methods” section.

