Figure 6.
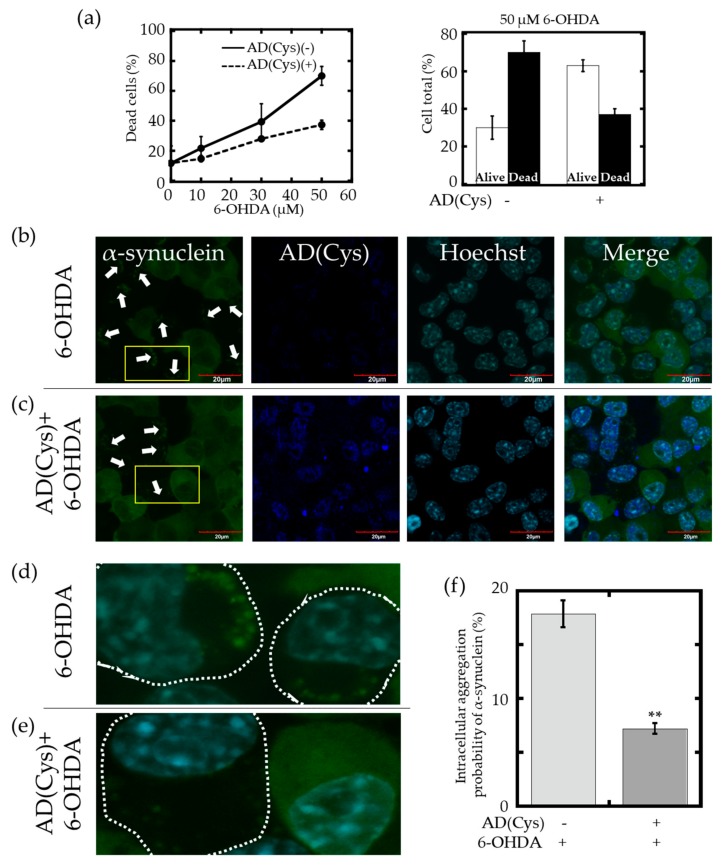
(a) Left: cell death rate. Data are expressed as a percentage of Ethidium Homodimer 1 (EthD-1)-positive cells. Right: the percentage of alive cells and dead cells under the oxidative stress condition of 50 μM 6-OHDA. The error bars represent ± SEM. (b,c) Immunofluorescence staining of AD(Cys) in green fluorescent protein-tagged human α-synuclein (GFP-Syn) expressing Neuro2a cells under 10 μM 6-OHDA-induced oxidative stress. The boxed regions in the images are magnified in (d,e), respectively. The white arrows indicate GFP-Syn aggregation in cells. Scale bars: 20 μm. (d,e) Enlargements of the merged GFP-Syn and Hoechst images of the yellow-boxed regions in (b,c), respectively. Cells with GFP-Syn aggregation are indicated by dotted lines. (f) Quantitative analysis of α-synuclein aggregation. The error bars represent ± SEM., Welch’s t-test, ** p < 0.01.

