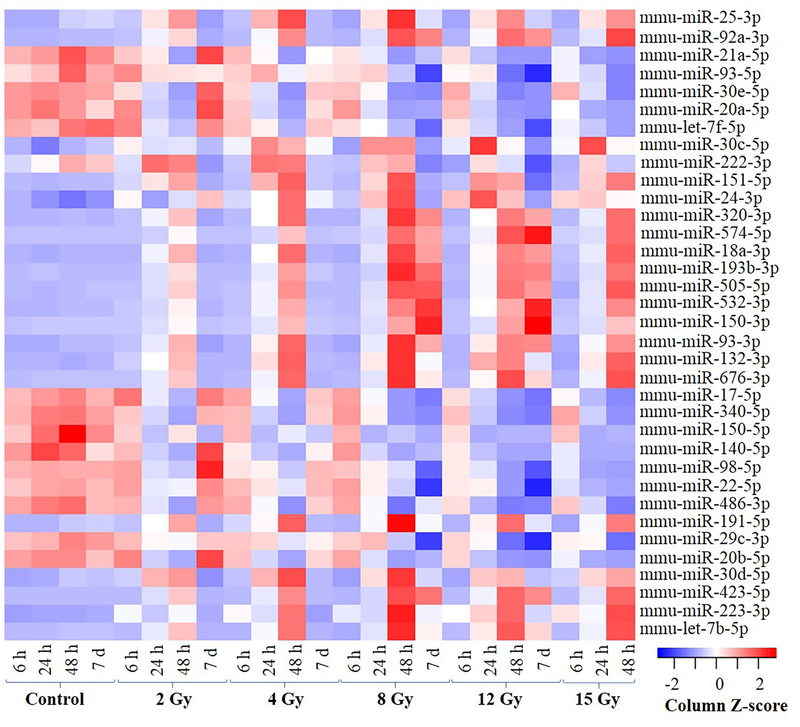
Figure 2: Heatmap showing expression values of the most significantly regulated miRNAs with lowest dose FDR across all the samples at all the time-points.
Results from 2-way ANOVA analysis after controlling the effect of time were selected at a FDR cutoff of ≤ 0.05. Hierarchical cluster analysis using correlation distance measure was used to generate the heatmap. The data was converted to z-score (with mean =1; and SD = 0) across the treatments to show relative expression.

