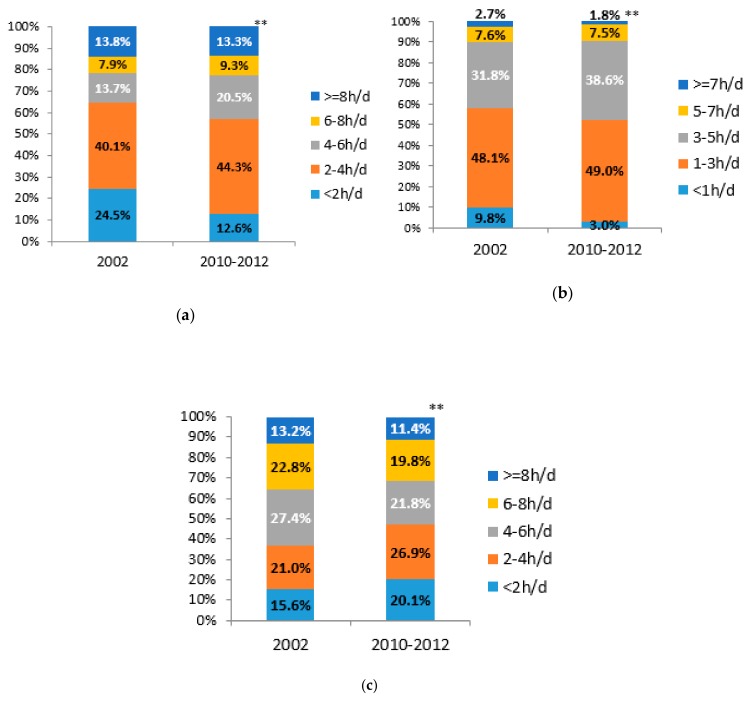
Figure 3.
Changes § in distribution of SB time among Chinese adults from 2002 to 2010–2012 (%): (a) changes in total SB time; (b) changes in leisure SB time; (c) changes in occupational SB time # (§ gender and age standardized to the 2010 China census population; # Time of occupational SB was only calculated in employed participants, n2002 = 126,25, n2010–2012 = 31,914; ** p < 0.001, significance is based on Chi–square tests).

