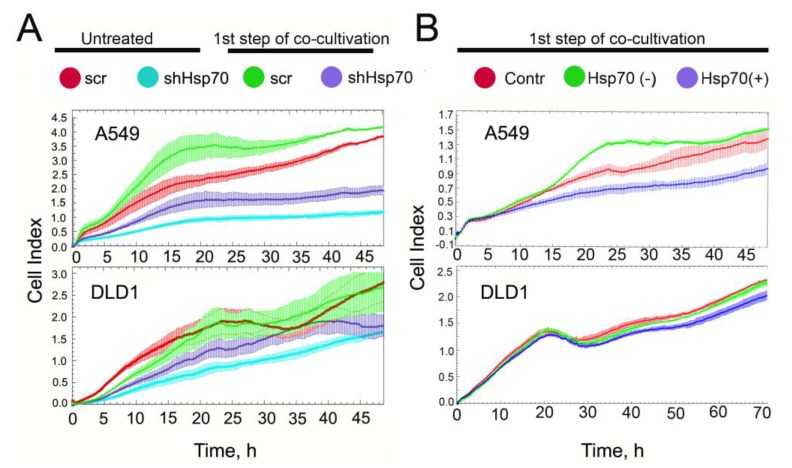
Figure 4.
Proliferation of tumor cells increased after co-cultivation with THP1 cells. (A) Untreated (red and blue curves) A549scr and A549shHsp70 and DLD1scr and DLD1shHsp70 cells and that after one co-cultivation step with THP1 monocytes (green and violet), were seeded on E-plates. Recording with xCELLigence equipment commenced when cancer cells attached to the bottom of the plates and lasted for 48 or 72 h. (B) The proliferation capacity of A549scr and DLD1scr cells treated as described above for “Hsp70(−)” and “Hsp70(+)” samples after co-cultivation with THP1 monocytes.

