Figure 1.
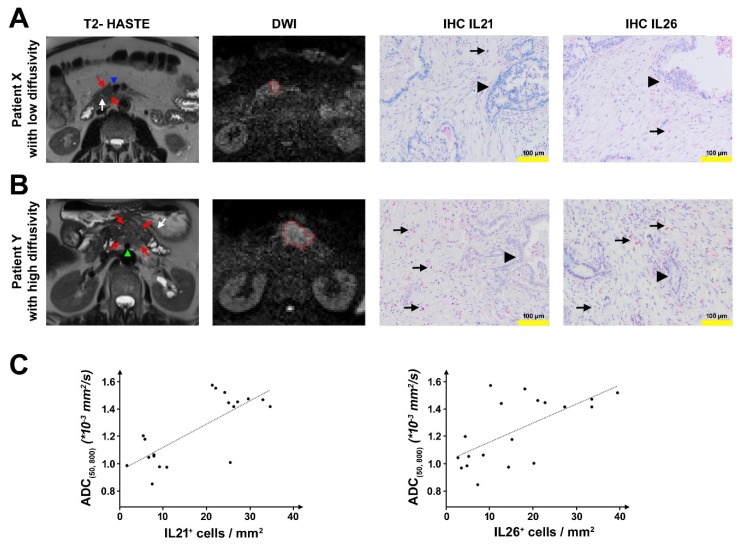
Radiological–pathological correlation. (A) Representative patient with a low apparent diffusion coefficient (ADC)(50, 800). Axial T2 half-Fourier acquisition single-shot turbo spin echo (HASTE) image shows a mildly hypointense lesion in the medial part of the uncinate process/ pancreatic head (red arrows) with direct contact to the superior mesenteric vein (blue arrowhead) and in proximity to the main pancreatic duct which is not dilated (white arrow). Diffusion-weighted image (DWI, b = 800 s/mm2) with the freehand volume of interest (VOI) from Reader 1 (red) surrounding the hyperintense lesion. Mean ADC(50, 800) for both Readers was 1.0469 × 10⁻³ mm2/s. Immunohistochemistry (IHC) shows low numbers of IL21+/IL26+ cells/mm2 (6.67 IL21+ cells/mm2 and 2.5 IL26+ cells/mm2) (arrow: red-stained IL21 or IL26 positive cells; arrowhead: tumor cells). (B) Representative patient with high ADC(50, 800). Axial T2 HASTE image shows a mildly hyperintense lesion in the pancreatic body (red arrows) with direct contact to the superior mesenteric artery (green arrowhead), upstream dilatation of the main pancreatic duct and concomitant parenchymal atrophy (white arrow). Diffusion-weighted image (DWI, b = 800 s/mm2) with the freehand VOI from Reader 1 (red) surrounding the hyperintense lesion. Mean ADC(50, 800) for both Readers was 1.4172 × 10⁻³ mm2/s. IHC shows high numbers of IL21+/IL26+ cells/mm2 (26.25 IL21+ cells/mm2 and 27.08 IL26+ cells/mm2) (arrow: red-stained IL21 or IL26 positive cells; arrow head: tumor cells). (C) Left: Dependency of the ADC(50, 800) on the number of IL21+ cells/mm2. Linear regression model: , Goodness of fit: ; Right: Dependency of the ADC(50, 800) on the number of IL26+ cells/mm2. Linear regression model: , Goodness of fit: .

