Figure 6.
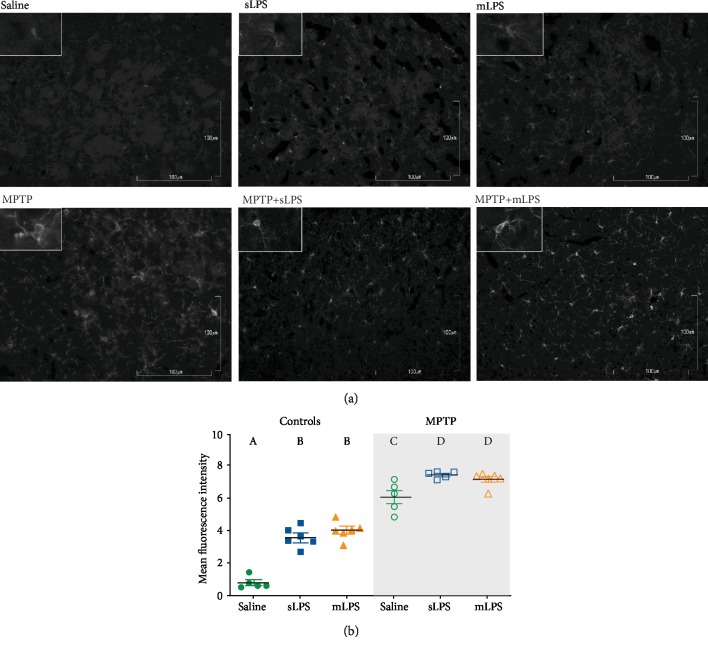
Iba1 staining increases in the striatum after LPS administration and MPTP challenge. Representative images showing Iba1 immunodetection in grayscale in the striatum of mice administered with saline solution, mLPS (100 μg/kg twice a week for three months), sLPS (5 mg/kg), and MPTP (30 mg/kg for five consecutive days) (a). Quantification of the fluorescence intensity of Iba1 staining in the striatum from the different experimental groups (b). Data represent mean ± SEM (n = 4‐6) and were analyzed by two-way ANOVA, followed by a Tukey's post hoc test. Different letters indicate significant differences among the experimental groups (P < 0.05).

