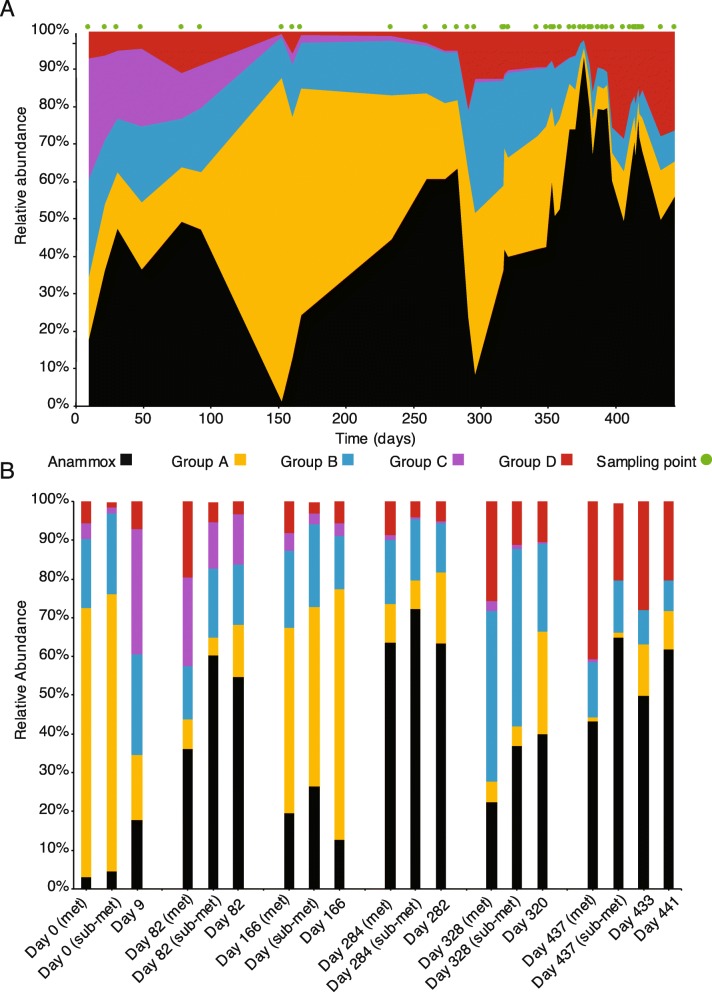
Fig. 3.
Relative abundances of bacterial groups over the lifespan of the bioreactor. a Relative abundances of bacterial Groups A–D, based on 16S rRNA OTUs that have a match to a draft genome. Group colors are matched by the analysis in Fig. 2, with the exception of Brocadia, which was removed from Group D and is depicted in black. Green points above the graph show timepoints where the community was sampled. b Comparison of relative abundances of the different groups at the same time (or the closest time) across sequencing platforms. Relative abundance was calculated for groups based on all the draft genomes (marked met on the x-axis), the subset of genomes with matched to the 16S rRNA OTUs (marked sub-met on the x-axis) or the 16S rRNA OTUs (only day is marked on x-axis)

