Fig. 7.
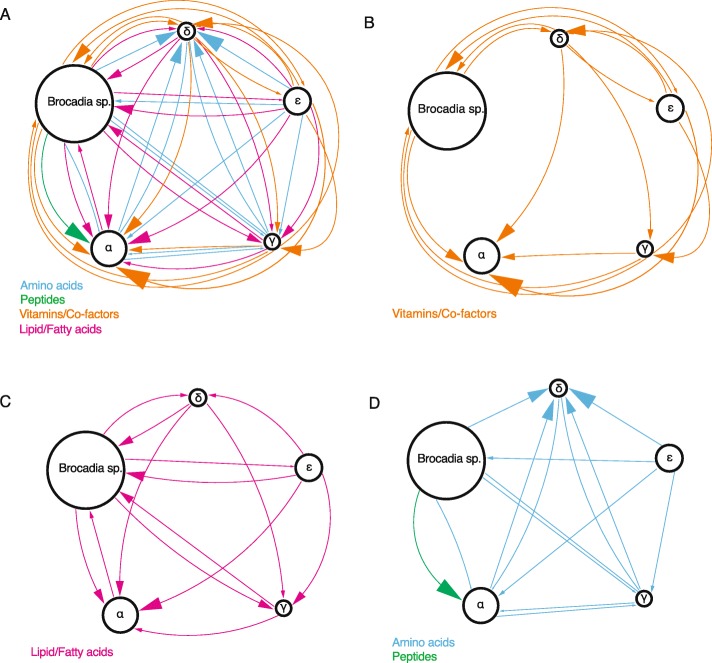
Potential metabolic interdependencies between the metabolic groups in the anammox bioreactor. a All potential metabolic interdependencies combined. b Metabolic interdependencies for vitamins/cofactors alone. c Metabolic interdependencies for lipids/fatty acids alone. d Metabolic interdependencies for amino acids and peptides alone. Arrows were assigned according to the absence of a group’s ability to synthesize a metabolite, and they connect to all groups that have the ability (there is redundancy in arrows). The arrowhead points at the group that receives the metabolite. The width of the arrow is proportional to the ratio of metabolites of a given type that are provided; amino acids, 20 metabolites; peptides, deduced from proteases and transporters (Fig. 5b); vitamins/cofactors, 10 metabolites; and lipids/fatty acids, 7 metabolites. The size of each group is proportional to their relative abundance at Day 437. Group β is not shown since it is assumed that all members obtain all of their nutrients and metabolites from their host. Overall, Groups ɑ and δ receive the most metabolites and Group ε receives the least. Group δ has the highest number of aa. synthesis auxotrophies and can potentially acquire these from many other community members. Group ε has only a single auxotrophy in vitamin/co-factor synthesis, while most other groups have multiple auxotrophies. Brocadia sp. is the only bacterium capable of vitamin B12 synthesis

