Fig. 5.

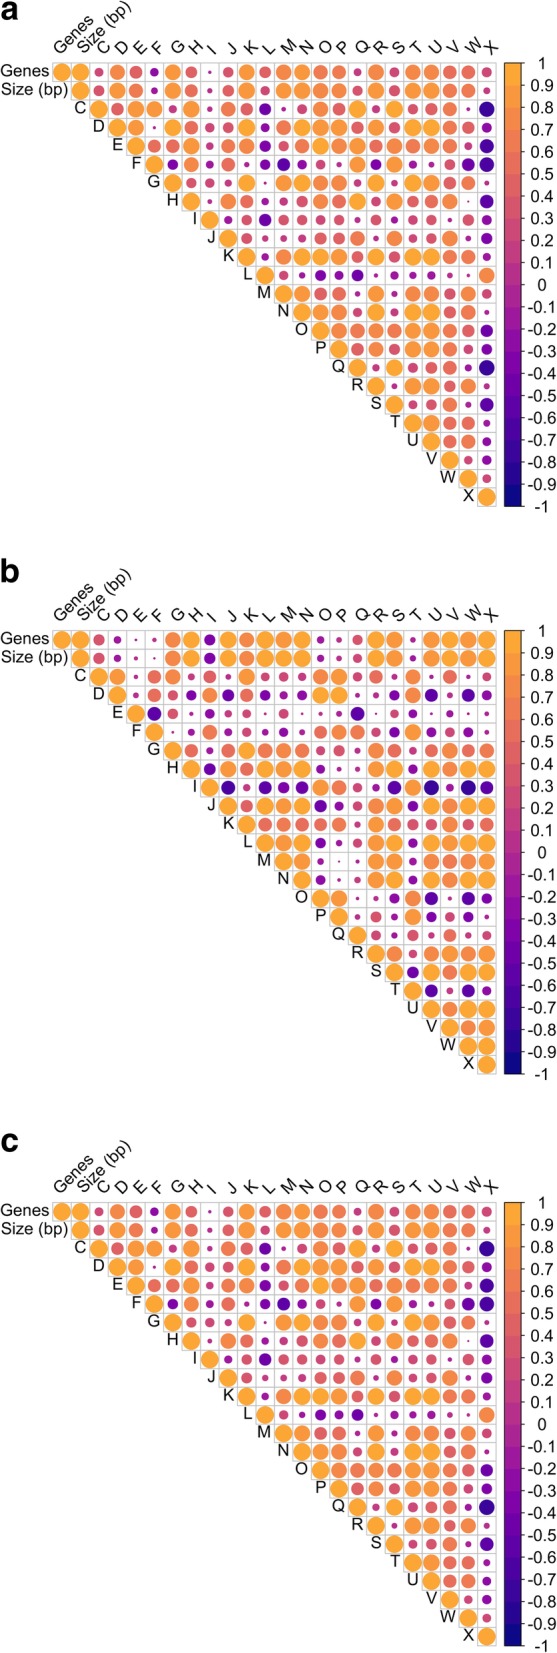
Correlation plots showing the correlations between different COG categories, genome size and number of genes in all of the pooled Enterococcus species (a), E. faecalis, (b) and E. faecium (c)

Correlation plots showing the correlations between different COG categories, genome size and number of genes in all of the pooled Enterococcus species (a), E. faecalis, (b) and E. faecium (c)