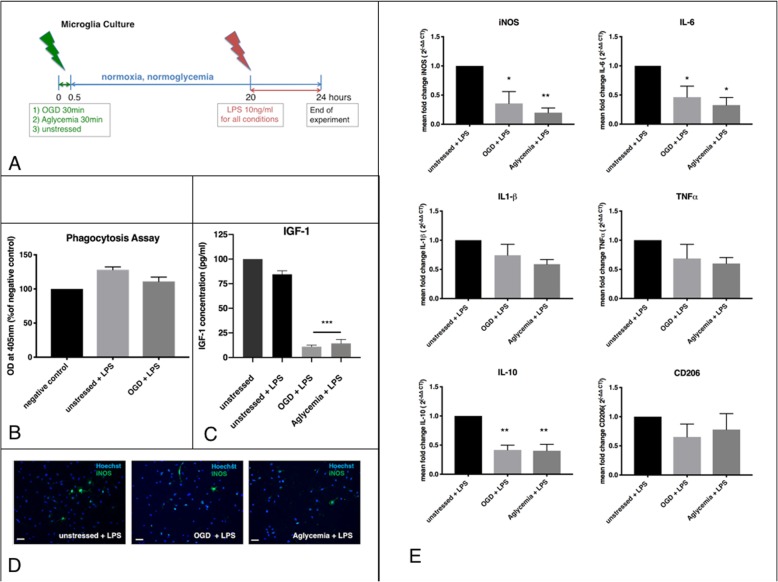
Fig. 2.
Microglia after preconditioning with metabolic stress, exposed to a strong inflammatory stimulus. a Experimental timeline. Microglia were exposed to metabolic stress by OGD or aglycemia for 30 min, and then allowed to recover in regular culture medium for 20 h. Subsequently, LPS as a robust inflammatory stimulus was applied at 10 ng/ml for 4 h. After this time, the cells were used for further experiments. Microglia treated with LPS served as controls. b Microglia were incubated with phagocytic beads (zymosan) for 2 h, and zymosan uptake was quantified photometrically. Untreated cells without zymosan incubation served as the negative control. There was no significant effect of OGD + LPS on the phagocytic activity of microglia compared to only LPS-treated cells (values displayed as means ± SEM of three independent experiments with n = 6/each condition). c An IGF1-ELISA was used to quantify IGF1 release in the cell supernatant photometrically. Both OGD + LPS and aglycemia+LPS treatment significantly reduced IGF1 release compared to only LPS-treated controls (values displayed as means ± SEM of three experiments with n = 12/each condition; the difference between treated groups: ***p < 0.0001 (one-way ANOVA/Tukey’s multiple comparison test). d Representative immunocytochemical images of iNOS+ cells (green), co-stained with a nuclear marker (Hoechst; blue). Staining for iNOS revealed less iNOS+ cells in microglia after OGD + LPS (middle panel) and in microglia after aglycemia+LPS (right panel) compared to only LPS-treated microglia (left panel) (scale bars = 50 μm). e Q-PCR revealed reduced expression of the markers iNOS, IL-6, and IL-10 after OGD + LPS, as well as after aglycemia+LPS, compared to LPS-only treated controls. Expression levels of TNFα, IL-1β, and CD206 did not differ between groups. Difference between OGD + LPS and aglycemia+LPS treated groups compared to LPS-treated control: *p < 0.05, ***p < 0.001 (values displayed as means ± SEM of one representative experiment of three independent experiments with at least n = 12/each condition; one-way ANOVA/Tukey’s multiple comparison test). Each Q-PCR sample was normalized to RPL13a as the reference gene, and mRNA levels were normalized to endogenous RPL13a expression

