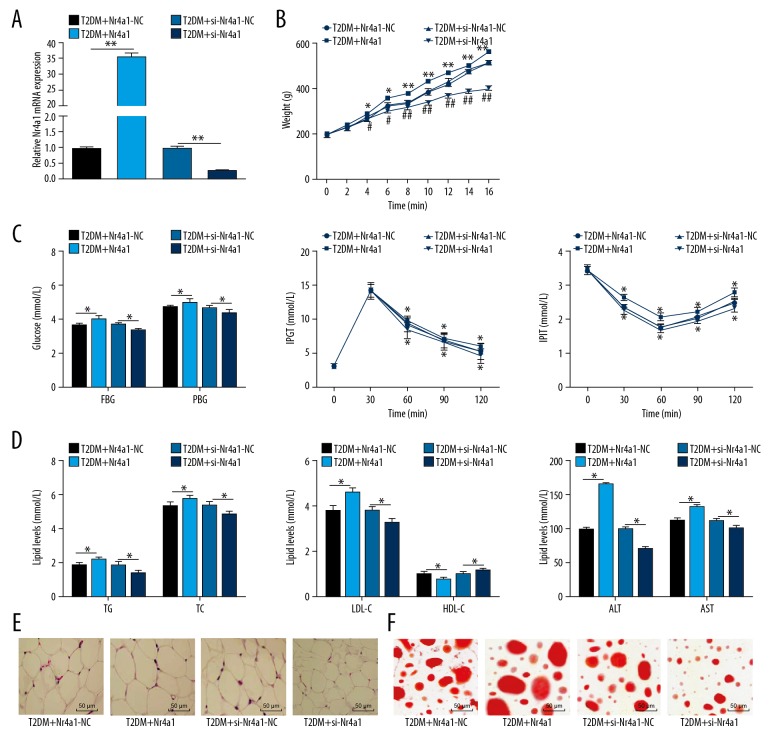
Figure 2.
Silencing Nr4a1 reduces glucose and lipid levels in T2DM rats. (A) Relative Nr4a1 mRNA expression in T2DM rats measured by RT-qPCR, n=3; (B) Weight of T2DM rats measured by an electronic balance, n=6; (C) Levels of blood glucose indicators in T2DM rats measured by blood glucose meter, n=6; (D) Levels of blood lipid indicators in T2DM rats measured by blood lipid kit, n=6; (E) Representative images of WAT volume in T2DM rats detected by HE staining, n=3; (F) Representative images of WAT lipid droplets in T2DM rats detected by oil red O staining, n=3. * For pair-wise comparison, p<0.05. Repetition=3. Data were analyzed by t test. Nr4a1 – nuclear receptor subfamily 4 group A member 1; WAT – white adipose tissue; T2DM – type 2 diabetes mellitus; HE – hematoxylin and eosin; RT-qPCR – reverse transcription quantitative polymerase chain reaction; AST – aspartate transaminase; ALT – alanine transaminase; FBG – fasting blood glucose; PBG – postprandial blood glucose; TC – total cholesterol; TG – triglyceride; HDL-C – high-density lipoprotein-cholesterol; LDL-C – low-density lipoprotein-cholesterol.

