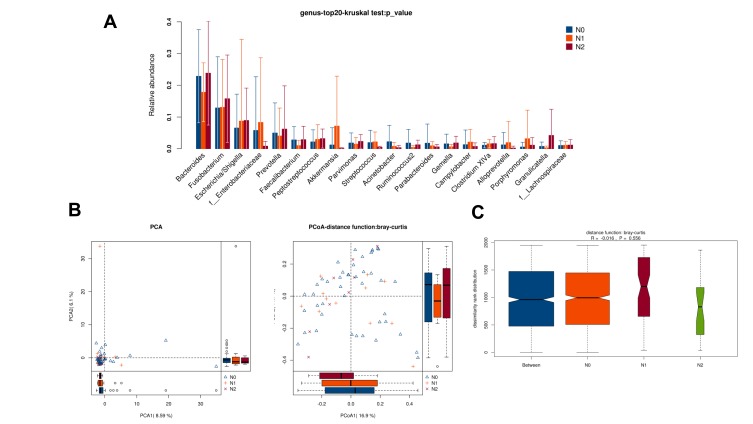
Figure 8.
Diversity comparison of microbiota assemblage among CRC patients with N0, N1 and N2 staging. (A) Relative abundance in top-20 species among CRC patients with N0, N1 and N2 staging was indicated by Wilcoxon test at the genus level; (B) PCA and PCoA; (C) Anosim analysis was performed among CRC patients with N0, N1 and N2 staging. Between: the difference between the two segments.

