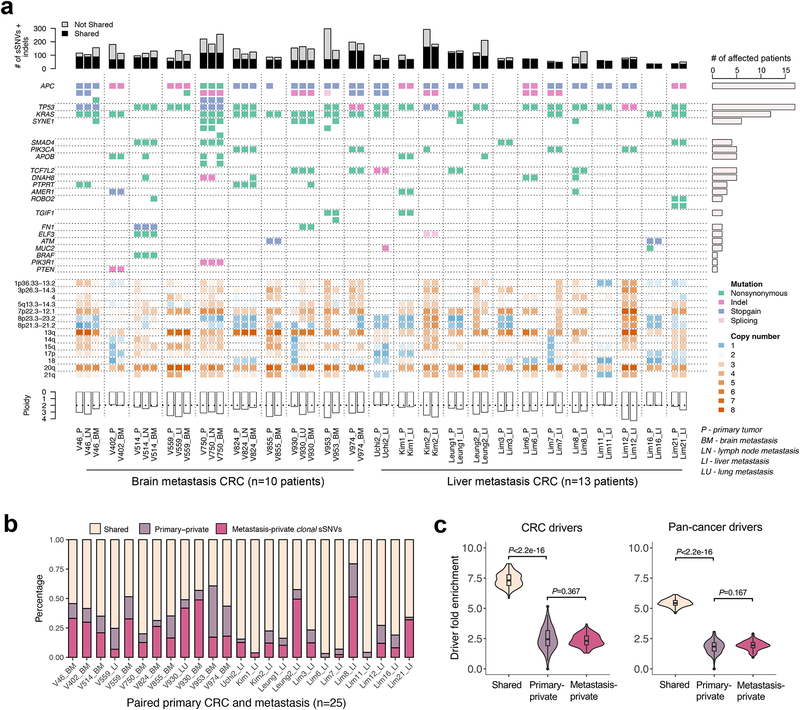
Figure 2. The mutational landscape and patterns of genetic divergence in paired primary CRCs and metastases.
(a) Concordance amongst somatic alterations (sSNVs, indels and CNAs) in known CRC ‘driver’ genes between paired primary CRCs and metastases. Stacked barplots illustrate the total number of sSNVs and indels in exonic regions with a lower cutoff of variant allele frequency (VAF)=0.1 in the corresponding site (primary or metastasis). (b) The percentage of clonal sSNVs that are shared, primary-private, or metastasis-private out of all clonal sSNVs with CCF>60% in any of paired primaries and distant metastases. (c) Violin plots illustrate the probability density of driver gene fold enrichment amongst shared, primary-private, and metastasis-private clonal non-silent sSNVs based on known CRC or pan-cancer ‘drivers’. The inset box corresponds to the 25th to 75th percentile (interquartile range, IQR); the horizontal line indicates the median; and the vertical line includes data within 1.5 times the IQR. A test statistic was computed based on n=100 down-samplings amongst patients (Methods). P-value, Wilcoxon Rank-Sum Test (two-sided).

