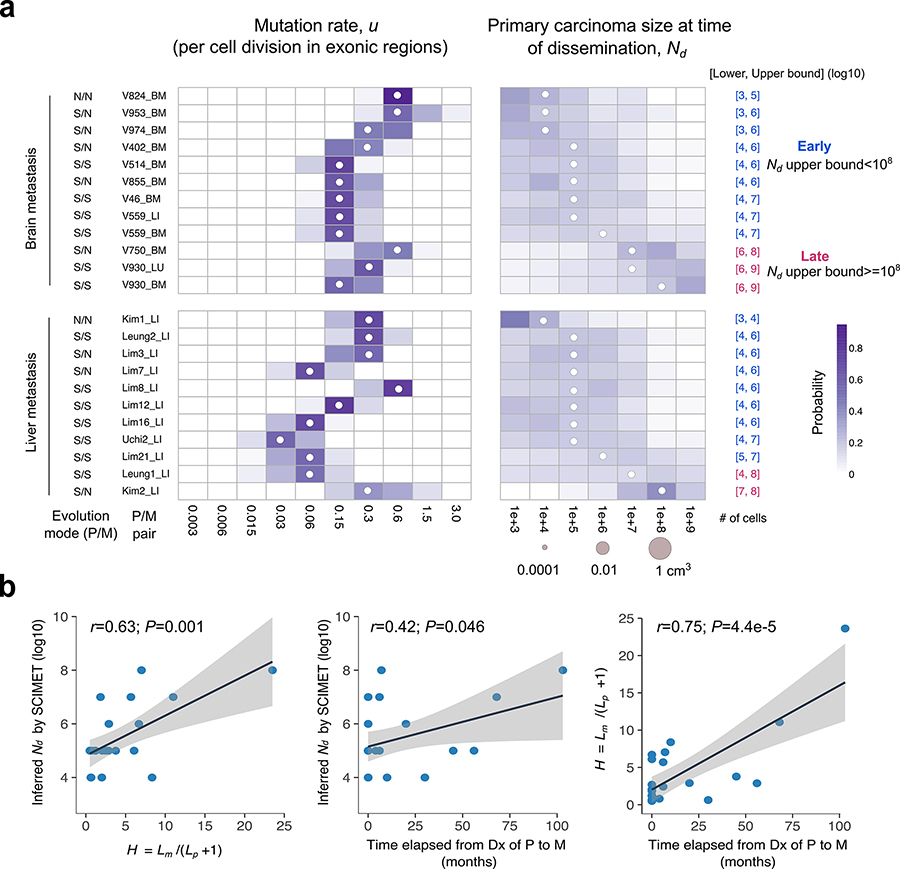
Figure 5. Patient-specific inference of the timing of metastasis in CRC.
(a) Heatmap of the posterior probability distributions inferred by SCIMET for the mutation rate u (per cell division in exonic regions) and Nd (timing of metastatic dissemination relative to primary carcinoma size) in individual P/M pairs (n=23) from 21 mCRC patients. The median of the inferred posterior distribution (referred to as the inferred Nd or) is indicated by a white circle at the corresponding value. For patients with more than one distant metastasis, each was analyzed independently. The mode of tumor evolution in each P/M pair was determined based on model selection within the statistical inference framework (Methods). We define early dissemination as Nd (upper bound) <108 cells (~1 cm3 in volume) and use the 3rd quartile of the posterior distribution as the upper bound to be conservative. Late dissemination is defined as Nd (upper bound) ≥108. P/M pairs where dissemination and seeding are inferred to have occurred early are denoted in blue, whereas those inferred to have disseminated late are denoted in magenta. (b) Correlations between the inferred timing of dissemination () based on SCIMET and the H metric as well as the time elapsed from diagnosis (Dx) of the primary to diagnosis of the metastasis (n=23). The Pearson’s r and P values are reported. Shading corresponds to 95% confidence interval of the linear regression.

