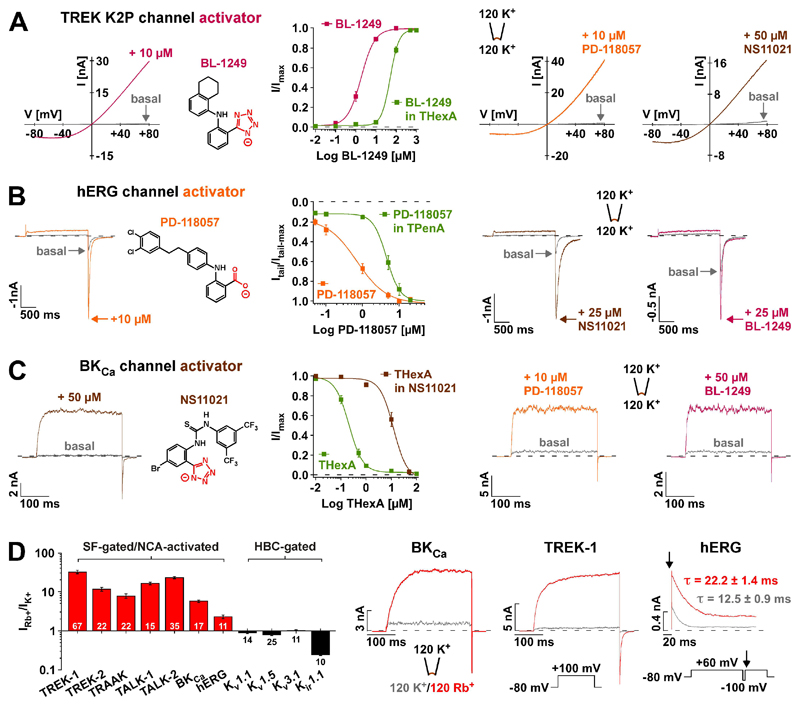
Fig. 1. Negatively charged activators (NCAs) open SF-gated K+ channels via a similar site.
(A) Representative TREK-1 channel currents recorded in inside-out (i-o) patches evoked by voltage ramps in the absence (basal) and presence of the indicated compounds. BL-1249 (compound structure depicted) dose-response curves represent currents at +40 mV ± 5 μM THexA that produced 77 ± 6 % inhibition of basal currents (n ≥ 8). (B) hERG channel currents (voltage steps from -80 mV to +60 mV) in i-o patches ± the indicated compounds; arrows indicate peak tail current amplitudes at -100 mV. PD-118057 dose-response curves represent normalized tail currents ± 1 μM TPenA that produced 91 ± 1 % inhibition of basal currents (n ≥ 6). (C) BKCa channel currents (voltage steps from a holding potential of -80 mV to +100 mV (zero Ca2+)) in i-o patches ± the indicated compounds. THexA inhibition represents currents at +100 mV ± 50 μM NS11021 (compound structure depicted; n ≥ 11). (D) Bars ± S.E.M represent fold change of outward currents upon exchange of intracellular K+ by Rb+ for K2P and BKCa channels (+100 mV), for hERG, Kv1.1, Kv1.5, Kv3.1 channels (+60 mV) and Kir1.1 channels (+40 mV). The channels are grouped as either SF-gated/NCA-activated or HBC (helix-bundle crossing)-gated. (E) Representative traces of Rb+ activation for BKCa, TREK-1 and hERG channels using indicated protocols (arrow indicates the starting point of hERG inactivation after inactivation recovery (at -100 mV)). τ values from mono-exponential fits to inactivation time course (n ≥ 12).

