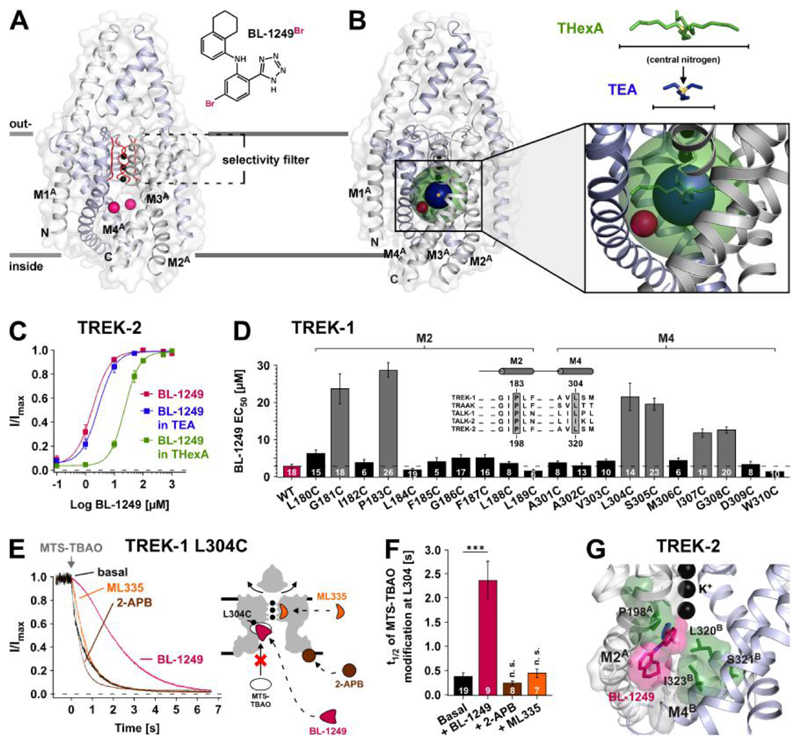
Fig. 2. Identification of the BL-1249 binding site in TREK K2P channels.
(A) The structure depicts TREK-2 (PDB ID: 4XDJ), with pink spheres representing the positions of Br atoms in a brominated BL-1249 derivate (BL-1249Br) obtained by co-crystallization of TREK-2 and BL-1249Br (see also fig. S3). With this medium resolution data only the Br atoms were identified, as they gave peaks in anomalous difference maps. (B) The same structure also showing spherical representations of THexA (green) and TEA (dark blue) with their central nitrogen atoms (yellow). Their positions are based on the crystal structures of KcsA with QA+s (16). Note the Br atoms (pink) are within the sphere of THexA, but not of TEA. (C) BL-1249 dose-response curves for TREK-2 ± 100 mM TEA (n ≥ 12) or 5 μM THexA (n ≥ 13) (TEA and THexA produce 74 ± 3 % and 83 ± 2 % basal current inhibition, respectively). (D) Scanning mutagenesis of M2 and M4 helices showing BL-1249 EC50 values ± S.E.M determined at +40 mV; inset shows a K2P channel alignment for channels strongly activated by BL-1249 (see also fig. S1D) with residues homologous to TREK-1 P183 and L304 highlighted. (E) Time courses of 10 μM MTS-TBAO cysteine modification of L304C in TREK-1 before and after maximal activation by BL-1249 (50 μM), ML335 (50 μM) and 2-APB (1 mM) (left panel). Cartoon depicts TREK-1 with predicted drug binding sites relative to position of residue L304C. (F) Time values ± S.E.M for half maximal MTS-TBAO modification inhibition (t1/2) in presence of different agonists. (G) Representation of favoured binding pose of BL-1249 (pink) in TREK-2 along with location of the TREK-1 corresponding mutations (green) that reduce BL-1249 activation.

