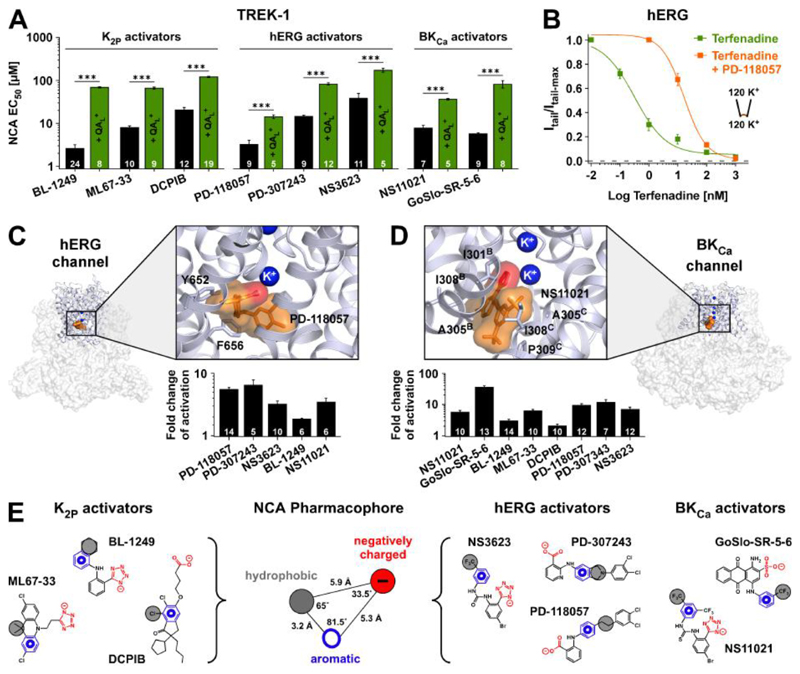
Fig. 4. NCA binding sites and common pharmacophore.
(A) EC50 values (at +40 mV) for TREK-1 activation with compounds described as activators of either K2P, hERG or BKCa channels. Competitive antagonism is seen in presence of QAL+ (either THexA or TPenA which produce ~70 - 80 % inhibition of respective basal K+ currents). (B) Terfenadine inhibition of hERG channels ± 10 μM PD-118057. (C) Structure of the hERG channel (PDB ID: 5VA1) with the pore region expanded. This region was used for molecular docking and MD simulations to obtain the favoured binding pose of PD-118057 (orange). Terfenadine interacting residues are highlighted. Note the carboxylate group (red) interacts with a K+ ion below the SF (see also fig. S7D); bar chart below represents fold activation of hERG tail currents at -100 mV with 10 μM of the indicated compounds. (D) Similar to (C) but for the BKCa channel (PDB ID: 5TJI) showing the favoured binding pose of NS11021 (orange) where the tetrazole group (red) interacts with a K+ ion below the SF and residues in proximity to NS11021 highlighted. The bar chart below shows fold activation of BKCa at +100 mV with 10 μM of the indicated compounds (at zero Ca2+). (E) Representation of the K2P, hERG and BKCa activators used to generate a common NCA pharmacophore consisting of aromatic (blue), hydrophobic (gray) and acidic (red) moieties with distances and angles as depicted.

