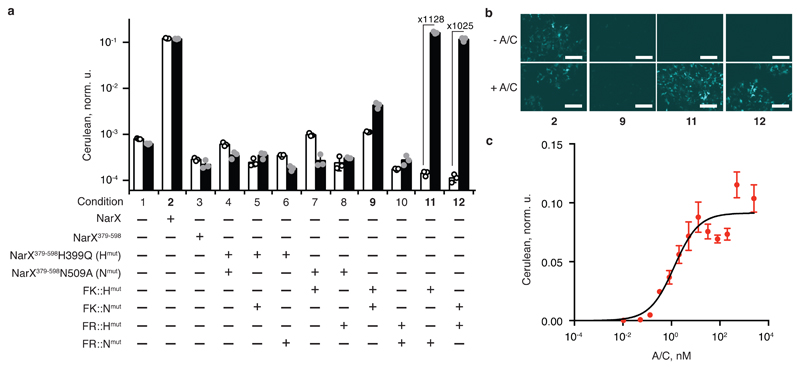
Fig. 3. Transduction of cytoplasmic ligand to gene expression.
a, Ligand-induced signaling with the help of FKBP/FRB fusions. The bars show Cerulean levels in cells coexpressing NarL and the indicated combination of NarX- and FKBP- or FRB- derived constructs, in the presence of NarL-inducible Cerulean reporter. The white and the black bars show Cerulean expression in the absence and in the presence of 100 nM of A/C ligand, respectively. The fold change of A/C induction is shown for conditions 11 and 12. See Supplementary Fig. 6 for schematic illustrations of the process. b, Microscopy images of HEK293 cells for conditions shown in bold in panel a. The top and the bottom rows show, respectively, the reporter expression in the absence and in the presence of A/C. The numbers correspond to the conditions in panel a. c, Dose response to the amount of A/C dimerizer. NarL-regulated Cerulean reporter expression is shown for different A/C concentrations in the presence of NarL and the pair FR::Hmut and FK::Nmut. In this figure, Cerulean levels are normalized to the transfection control and averaged over a biological triplicate, shown as mean ± SD. The circles indicate individual measurements. The white scale bar in b corresponds to 200 μm. The DNA constructs are described in Supplementary Fig. 1. The results were reproduced at least once in an independent experiment.

