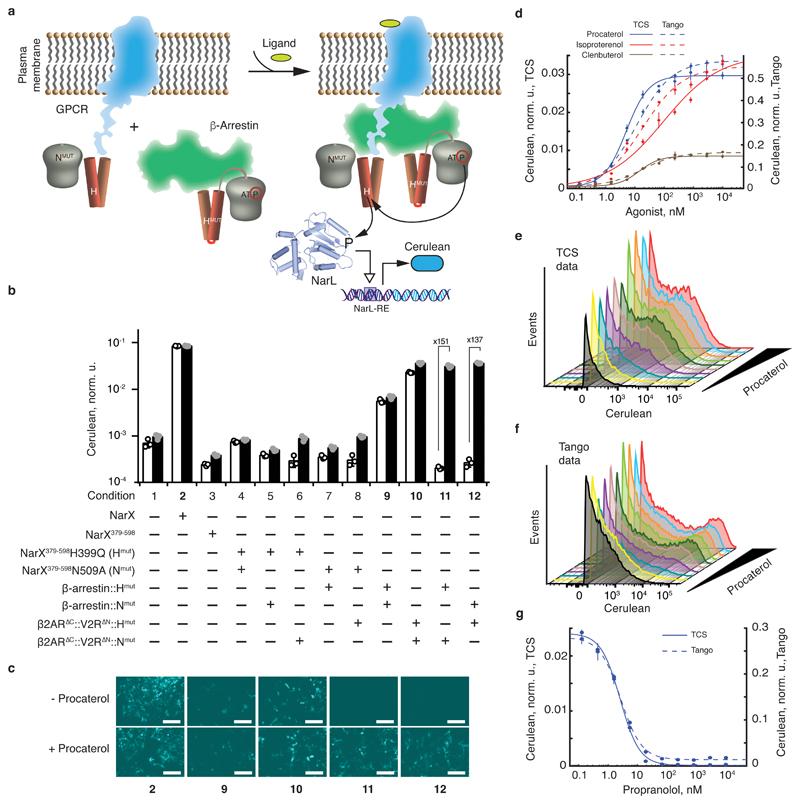
Fig. 4. Rewiring the GPCR activity to the expression of a reporter gene.
a, Schematics of transducing ligand-induced GPCR/β-arrestin interaction34 into gene expression via TCS machinery. b, Ligand-induced reporter activation via GPCR rewiring. NarL-inducible Cerulean expression is shown in the presence of NarL and the indicated NarX-, β2AR∆C::V2R∆N, and/or β-arrestin-derived constructs. The white and the black bars correspond to the absence and the presence of 2 μM procaterol, respectively. The fold-change of procaterol-triggered induction is shown for the conditions 11 and 12. c, Microscopy images of HEK293 cells for selected conditions shown in bold in panel a. The top and the bottom rows show reporter expression without and with 2 μM of procaterol, respectively. The numbers correspond to the conditions in a. d, Reporter expression as a function of different β2AR agonists' concentration. Full lines represent the results obtained with β2AR∆C::V2R∆N::Hmut and β-arrestin::Nmut in the presence of NarL and NarL-regulated Cerulean reporter (TCS). Dotted lines represent the results obtained with the Tango assay using chimeric GPCR βAR∆C::V2R∆N::tTA. The primary Y axis is used for the TCS data and the secondary Y axis is used for Tango data. d, e, Fluorescence histograms in Cerulean-positive cells obtained for increasing amounts of procaterol with the TCS-based transduction (d) and Tango (e). f, Dose response to the antagonist propranolol in the presence of 100 nM of procaterol. The full line shows data obtained with TCS-based transduction and the dashed line summarizes data obtained with Tango assay. Primary and secondary Y-axes are as in (d). All values in the bar chart and the graph are Cerulean levels normalized to transfection control and averaged over a biological triplicate, shown as mean ± SD. The circles indicate individual measurements. The white scale bar in c corresponds to 200 μm. The DNA constructs are described in Supplementary Fig. 1. The results were reproduced at least once in an independent experiment.

