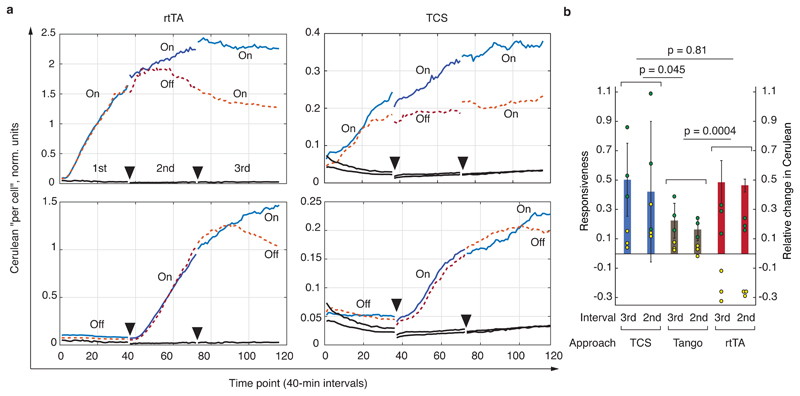
Fig. 6. Dynamic characterization of the various signaling approaches.
a, Selected time lapse traces of normalized output expression. Charts show, from left to right, the response of rtTA-Doxycycline (rtTA) system, and GPCR signaling via TCS pathway (Hmut fusions). Each trace is labeled either On or Off, with On indicating the presence of a ligand and Off means absence of a ligand during the measurement interval. Dotted lines indicate time course that include an Off condition during the 2nd or the 3rd interval, and solid lines are time courses with On conditions during both the 2nd and the 3rd interval. Full triangles indicate the endpoints of the measurement intervals. Solid black lines are background readouts. See Supplementary Fig. 11 for the entire dataset including the time traces obtained with the Tango assay. b, Responsiveness compared for the three approaches. The interval (3rd or 2nd, see also top left chart in panel a) indicated on the X axis is the interval during which the On and the Off responses were compared. The yellow and the green dots, respectively, represent the relative change in the expression of the Cerulean reporter (see Methods and Supplementary Fig. 12) during the On (green) and Off (yellow) intervals. The bars indicate the responsiveness during each interval, i.e., the difference between the relative Cerulean change during an On and Off interval (Methods), and the error bars are calculated from the raw data (circles) using appropriate error propagation. The p-values are the products of the p-values calculated for the responsiveness comparison between matched intervals (2nd vs 2nd and 3rd vs 3rd, two-sided t-test, 8 degrees of freedom, also see Methods). The primary Y axis shows responsiveness and the secondary Y axis shows relative change in the Cerulean expression. The entire experiment was performed once, every condition was measured as a biological triplicate, and the conclusions are drawn upon analysis of six independent measurements (three for the 2nd and three for the 3rd interval comparison).

