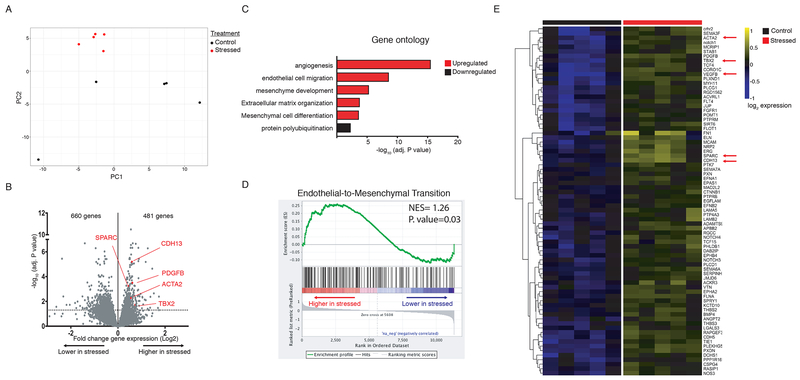
Fig. 2. RNA-sequencing of ventricular tissue from stressed and nonstressed rats.
Principal component analysis of gene expression profiles indicated that hearts from nonstressed rats have variable baseline gene expression that separated on principal component 1 (PC1), while hearts from all 5 stressed rats clustered closely and were separated by principal component 2 (PC2) (A). A volcano plot illustrating gene expression alterations and P values for 12,218 genes. Genes of interest are annotated in red (B). Gene ontology analysis identified significantly enriched gene family clusters for upregulated (red) or downregulated (black) genes (C). Genes were ranked in order of most to least enriched in stressed hearts and analyzed by Geneset Enrichment Analysis (GSEA). The enrichment plot shows the normalized enrichment score (NES) for genes associated with endothelial-to-mesenchymal transition (D). Heatmap showing median-centered, log2-fold changes for select upregulated genes identified from Gene Ontology families in panel C (E).

