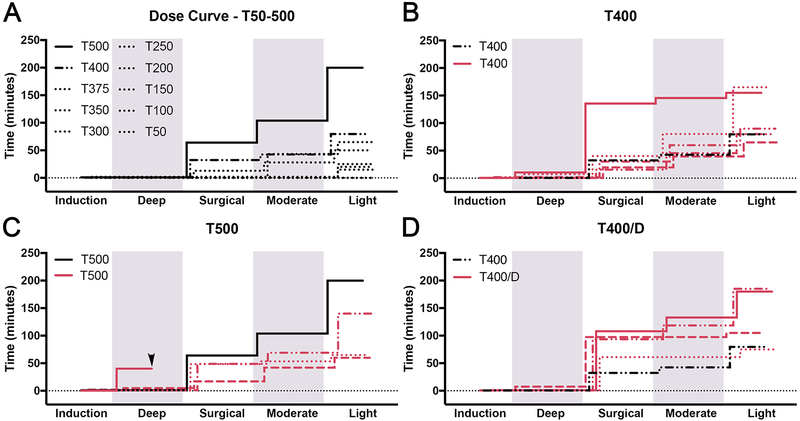
Figure 3:
Anesthesia effects of TBE in lizards. (A-D) Staggered stepwise graphs summing the total time individual lizards spent at each plane of anesthesia. (A) Dose curve of TBE (n = 10); dose ranges from 50mg/kg (T50) to 500mg/kg (T500). Graphs (B-D) display T400 (n = 5), T500 (n = 4), and T400/D (n = 4). Arrowhead in (B) represents a lizard death. Shading delineates the boundaries of different anesthesia levels.

