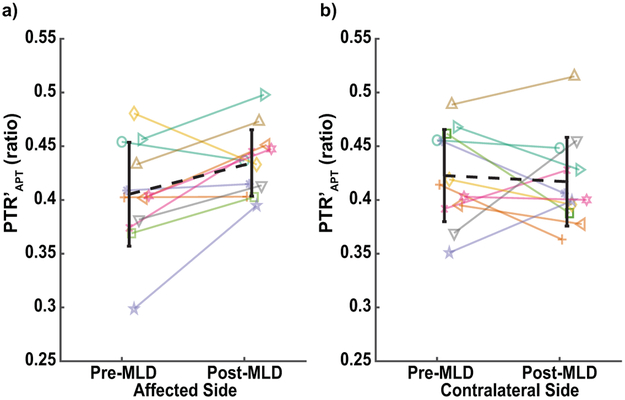
Figure 6.
Change in PTR’APT in the a) affected and b) contralateral arms pre- and post-MLD therapy is demonstrated for each BCRL participant with a unique line color and symbol combination. The group mean change is represented by the black, dashed line on each graph. Group mean PTR’APT was significantly increased in the affected arm compared to baseline imaging (p=0.02) but not in the contralateral arm (p=0.68).

