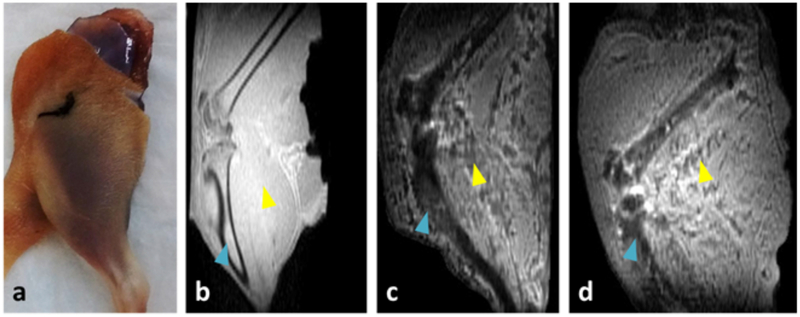
Figure 1:
Imaging of rat hindlimb. Photo of rat hindlimb post-perfusion (a). MB-SWIFT T1-weighted images of hindlimbs perfused with VS55 (b), VS55 with IONPs (EMG-308, 179 mMFe; 10 mgFe/mL) (c), and unloaded after perfusion with VS55 with IONPs (d). The blue triangles mark the location of the tibia. The yellow triangles mark the location of the muscle. In the case of (c) and (d), pile-up artifacts are visible within the muscle.

