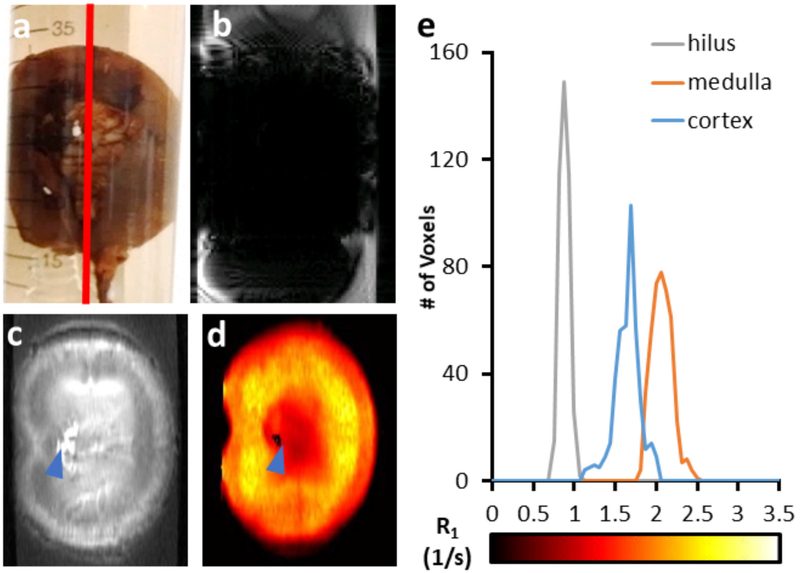
Figure 3:
The distribution of IONPs (EMG-308; 71 mMFe) is visually homogeneous in the rabbit kidney when perfused with M22 (a). A GRE image of the rabbit kidney demonstrates negative contrast and very large artifacts (b). The T1-weighted MB-SWIFT image demonstrates contrast throughout the kidney (c). The R1 map further indicates variation in IONP concentration throughout the structure of the kidney (d). A 2.9 × 5.8 mm2 (15 × 30 voxel) ROI was drawn within the hilus, medulla, and cortex to demonstrate the difference in R1 between these anatomical regions (e).

