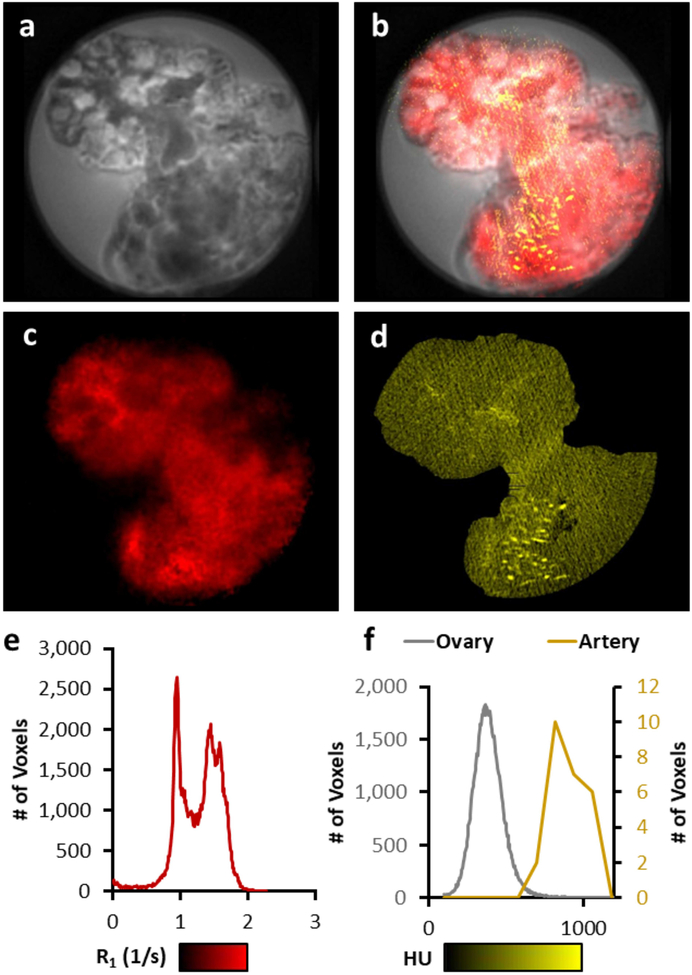
Figure 6:
A comparison of MRI and μCT imaging capability. The T1-weighted image of ovary perfused with IONPs (a) shows a region where IONP concentration is visible within the ovary using MB-SWIFT T1-weighted imaging (white circle) and a region where pile-up artifacts are visible due to the high concentration within the ovarian artery (blue circle) (a). An overlap of the T1-weighted images of ovary with R1 mapping (red) and μCT (yellow) demonstrate that the high concentration of IONP causing pile-up artifacts are visible using μCT (blue circle), and that μCT is unable to be resolved from the VS55 background within the ovary (white circle) (b). The R1 map (1 to 2 s−1) demonstrates some variation in R1 across the tissue (c & e). The μCT in Hounsfield units (100 to 1000 HU) shows a similar background across the tissue, but high HU within the vasculature (blue arrow/artery) (d & f).

